Volume 2 Number 4A
November 2006 AHigh Productivity Computing Systems and the Path Towards Usable Petascale Computing
Introduction
Jeremy Kepner, MIT Lincoln Laboratory
High Performance Computing has seen extraordinary growth in peak performance from Megaflops to Teraflops in the past decades. This increase in performance has been accompanied by a large shift away from the original national security user base of the 1970s and 1980s to more commercially oriented applications (e.g., bioinformatics and entertainment). In addition, there has been a significant increase in the difficulty of using these systems, which is now the domain of highly specialized experts. In response to these trends the DARPA High Productivity Computing Systems (HPCS) program was established to produce a new generation of economically viable, high productivity computing systems for the national security and for the industrial user communities. The primary technical goals of the program are to produce petascale computers that can better run national security applications and are usable by a broader range of scientists and engineers. The HPCS program is fostering many technological innovations, and two of the more noteworthy include: the concept of a "flatter" memory hierarchy (to accelerate a whole new set of applications) and high level programming languages (to allow a new set of users to take advantage of petascale systems).
Beyond just producing petascale systems that are easier to use, the HPCS program has also funded a team of researchers to explore how to better measure productivity. This special double issue of CTWatch Quarterly features 17 articles on the topic written by folks who have devoted themselves to these questions for the past few years. The articles are broken down into two groups. The first group "User Productivity Challenges" consists of a series of broader and more easily accessible articles that seek to highlight the user experience with HPC Technologies and the current issues therein. The second group "System Productivity Technologies" is made up of more deeply technical articles that describe specific technologies for enhancing productivity. Although CTWQ is not a traditional technical journal and would not normally carry articles in the second group, we felt it was important to try to present a more complete and balanced picture of the HPCS Productivity effort and give it the kind of wide exposure that CTWQ's on-line publication model makes possible.
The articles deal with the question of productivity from a number of perspectives. Tools are then provided for folks who want to look at productivity from an organizational perspective, from an individual programmer perspective, or from the perspective of a hardware or software innovator. From the technology innovator's perspective I think we have provided two particularly useful tools. The HPC Challenge benchmarks developed under HPCS is a suite of benchmarks that allows hardware designers to get credit for innovating above and beyond the design space defined by the Top500 benchmark. The HPC software development measurement system developed under HPCS allows software designers to conduct detailed experiments with programmers and determine precisely where the users spend their time.
The productivity of HPC users intrinsically deals with some of the brightest people on the planet, solving very complex problems, using the most complex computers in the world. Anyone who truly wants to get insight into such a complex situation must be prepared to invest some time in the endeavor. However, I am confident that those who do will find the effort rewarding.
This work is sponsored by the Defense Advanced Research Projects Administration under Air Force Contract FA8721-05-C-0002. Opinions, interpretations, conclusions, and recommendations are those of the author and are not necessarily endorsed by the United States Government.
Suzy Tichenor, Council on Competitiveness
Albert Reuther, MIT Lincoln Laboratory
1
High performance computing (HPC), also known as supercomputing, makes enormous contributions not only to science and national security, but also to business innovation and competitiveness—yet senior executives often view HPC as a cost, rather than a value investment. This is largely due to the difficulty businesses and other organizations have had in determining the return on investment (ROI)1 of HPC systems.
Traditionally, HPC systems have been valued according to how fully they are utilized (i.e., the aggregate percentage of time that each of the processors of the HPC system is busy); but this valuation method treats all problems equally and does not give adequate weight to the problems that are most important to the organization. With no ability to properly assess problems having the greatest potential for driving innovation and competitive advantage, organizations risk purchasing inadequate HPC systems or, in some cases, foregoing purchases altogether because they cannot be satisfactorily justified.
This stifles innovation within individual organizations and, in the aggregate, prevents the U.S. business sector from being as globally competitive as it could and should be. The groundbreaking July 2004 "Council on Competitiveness Study of U.S. Industrial HPC Users," 2 sponsored by the Defense Advanced Research Projects Agency (DARPA) and conducted by market research firm IDC, found that 97 percent of the U.S. businesses surveyed could not exist, or could not compete effectively, without the use of HPC. Recent Council on Competitiveness studies reaffirmed that HPC typically is indispensable for companies that exploit it 3.
It is increasingly true that to out-compete, companies need to out-compute. Without a more pragmatic method for determining the ROI of HPC hardware systems, however, U.S. companies already using HPC may lose ground in the global competitiveness pack. Equally important, companies that have never used HPC may continue to miss out on its benefits for driving innovation and competitiveness.
To help address this issue, we present an alternative to relying on system utilization as a measure of system valuation, namely, capturing the ROI by starting with a benefit-cost ratio (BCR) calculation. This calculation is already in use at the Massachusetts Institute of Technology, where it has proven effective in other contexts.
Nicole Wolter, San Diego Supercomputing Center
Michael O. McCracken, San Diego Supercomputing Center
Allen Snavely, San Diego Supercomputing Center
Lorin Hochstein, University of Nebraska, Lincoln
Taiga Nakamura, University of Maryland, College Park
Victor Basili, University of Maryland, College Park
1
1. Introduction
High performance computing, as a field, involves a great deal of interdisciplinary cooperation. Researchers in computer science work to push the boundaries of computational power, while computational scientists use those advances to achieve increasingly detailed and accurate simulations and analysis. Staff at shared resource centers enable broad access to cutting edge systems while maintaining high system utilization.
Attempts to evaluate the productivity of an HPC system require understanding of what productivity means to all its users. While each of the above groups use HPC resources, their differing needs and experiences affect their definition of productivity. This, in turn, affects decisions about research directions and policies. Because so much is at stake, measuring and comparing productivity is not to be taken lightly. There have been many attempts to define productivity quantitatively, for example, see Kuck 1 for a definition of user productivity and Kepner 2 for a definition of the productivity of a system.
Our approach avoids the problems involved in trying to quantify productivity and instead defines the productivity of a system in terms of how well that system fulfills its intended purpose. Certainly the intended purpose of an HPC system is not just to stay busy all the time, but instead to deliver scientific results. Working with the San Diego Supercomputer Center (SDSC) and its user community, we have analyzed data from a variety of sources, including SDSC support tickets, system logs, HPC developer interviews, and productivity surveys distributed to HPC users. In order to better understand exactly how HPC systems are being used, and where the best opportunities for productivity improvements are, we have compiled a list of conjectures about HPC system usage and productivity (each originally suggested by experienced researchers in HPC) and have compared these to the usage patterns and attitudes of actual users through four studies. The seven conjectures are as follows:
- HPC users all have similar concerns and difficulties with productivity.
- Users with the largest allocations and the most expertise tend to be the most productive.
- Computational performance is usually the limiting factor for productivity on HPC systems.
- Lack of publicity and education is the main roadblock to adoption of performance and parallel debugging tools.
- HPC programmers would require dramatic performance improvements to consider making major structural changes to their code.
- A computer science background is crucial to success in performance optimization.
- Visualization is not on the critical path to productivity in HPC in most cases.
In the discussion that follows, we evaluate each of the conjectures. After summarizing the data sources we used and how we collected them, we present our findings and try to clarify how well each of these beliefs actually stands up to the evidence.
Piotr Luszczek, University of Tennessee
Jack Dongarra, University of Tennessee, Oak Ridge National Laboratory
Jeremy Kepner, MIT Lincoln Lab
1
Introduction
The HPCC benchmark suite was initially developed for the DARPA's HPCS program 1 to provide a set of standardized hardware probes based on commonly occurring computational software kernels. The HPCS program has initiated a fundamental reassessment of how we define and measure performance, programmability, portability, robustness and, ultimately, productivity in the high-end domain. Consequently, the suite was aimed to both provide conceptual expression of the underlying computation as well as be applicable to a broad spectrum of computational science fields. Clearly, a number of compromises must have lead to the current form of the suite given such a broad scope of design requirements. HPCC was designed to approximately bound computations of high and low spatial and temporal locality (see Figure 1 which gives the conceptual design space for the HPCC component tests). In addition, because the HPCC tests consist of simple mathematical operations, this provides a unique opportunity to look at language and parallel programming model issues. As such, the benchmark is to serve both the system user and designer communities 2.
Finally, Figure 2 shows a generic memory subsystem and how each level of the hierarchy is tested by the HPCC software and what are the design goals of the future HPCS system - these are the projected target performance numbers that are to come out of the wining HPCS vendor designs.
Figure 1. The application areas targeted by the HPCS Program are bound by the HPCC tests in the memory access locality space.
|
Figure 2. HPCS program benchmarks and performance targets.
|
Lorin Hochstein, University of Nebraska
Taiga Nakamura, University of Maryland, College Park
Victor R. Basili, University of Maryland, College Park; Fraunhofer Center, Maryland
Sima Asgari, University of Maryland, College Park
Marvin V. Zelkowitz, University of Maryland, College Park; Fraunhofer Center, Maryland
Jeffrey K. Hollingsworth, University of Maryland, College Park
Forrest Shull, Fraunhofer Center, Maryland
Jeffrey Carver, Mississippi State University
Martin Voelp, University of Maryland, College Park
Nico Zazworka, University of Maryland, College Park
Philip Johnson, University of Hawaii
1
1. Introduction
Much of the literature in the Software Engineering community concerning programmer productivity was developed with assumptions that do not necessarily hold in the High Performance Computing (HPC) community:
- In scientific computation insights culled from results of one program version often drives the needs for the next. The software itself is helping to push the frontiers of understanding rather than the software being used to automate well-understood tasks.
- The requirements often include conformance to sophisticated mathematical models. Indeed, requirements may often take the form of an executable model in a system such as Mathematica, and the implementation involves porting this model to HPC systems.
- "Usability" in the context of an HPC application development may revolve around optimization to the machine architecture so that computations complete in a reasonable amount of time. The effort and resources involved in such optimization may exceed initial development of the algorithm.
Due to these unique requirements, traditional software engineering approaches for improving productivity may not be directly applicable to the HPC environment.
As a way to understand these differences, we are developing a set of tools and protocols to study programmer productivity in the HPC community. Our initial efforts have been to understand the effort involved and defects made in developing such programs. We also want to develop models of workflows that accurately explain the process that HPC programmers use to build their codes. Issues such as time involved in developing serial and parallel versions of a program, testing and debugging of the code, optimizing the code for a specific parallelization model (e.g., MPI, OpenMP) and tuning for a specific machine architecture are all topics of study. If we have those models, we can then work on the more crucial problems of what tools and techniques better optimize a programmer’s performance to produce quality code more efficiently.
Since 2004 we have been conducting human-subject experiments at various universities across the U.S. in graduate level HPC courses (Figure 1). Graduate students in a HPC class are fairly typical of a large class of novice HPC programmers who may have years of experience in their application domain but very little in HPC-style programming. Multiple students are routinely given the same assignment to perform, and we conduct experiments to control for the skills of specific programmers (e.g., experimental meta-analysis) in different environments. Due to the relatively low costs, student studies are an excellent environment to debug protocols that might be later used on practicing HPC programmers.
Limitations of student studies include the relatively short programming assignments due to the limited time in a semester and the fact these assignments must be picked for the educational value to the students as well as their investigative value to the research team.
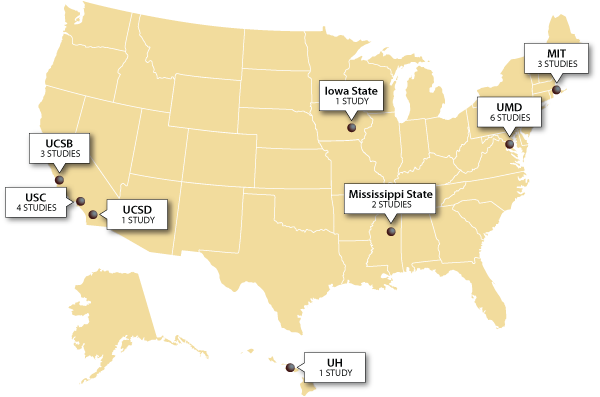
Figure 1. Classroom studies conducted.
In this article, we present both the methodology we have developed to investigate programmer productivity issues in the HPC domain (Section 2), some initial results of studying productivity of novice HPC programmers (Section 3), and current plans for improving the process in the future (Section 4).
Jeffrey C. Carver, Mississippi State University
Lorin M. Hochstein, University of Nebraska, Lincoln
Richard P. Kendall, Information Sciences Institute, University of Southern California
Taiga Nakamura, University of Maryland, College Park
Marvin V. Zelkowitz, University of Maryland, College Park; Fraunhofer Center for Experimental Software Engineering
Victor R. Basili, University of Maryland, College Park; Fraunhofer Center for Experimental Software Engineering
Douglass E. Post, DoD High Performance Computing Modernization Office
1
1. Introduction
Computational scientists and engineers face many challenges when writing codes for high-end computing (HEC) systems. With the movement towards peta-scale machines and the increasing focus on improving development productivity, writing a good code is even more challenging. The DARPA High Productivity Computing Systems (HPCS)1 project is developing new machine architectures, programming languages, and software tools to improve the productivity of scientists and engineers 2. Although the existence of these new technologies is important for improving productivity, they will not achieve their stated goals if individual scientists and engineers are not able to effectively use them to solve their problems. A necessary first step in determining the usefulness of new architectures, languages and tools is to gain a better understanding of what the scientists and engineers do, how they do it, and what problems they face in the current HEC development environment. Because the HEC community is very diverse 3, it is necessary to sample different application domains to be able to draw any meaningful conclusions about the commonalties and trends in software development in this community.
This paper discusses some of the similarities and differences found in ten projects taken from different domains as understood by researchers in the HPCS project. We have undertaken a series of case studies to gain deeper insight into the nature of software development for scientific and engineering software. These studies have focused on two different types of projects, (characterized in Table 1):
- ASC-Alliance projects, DOE-sponsored computational science centers based at University of Illinois Urbana-Champaign, California Institute of Technology, University of Utah, Stanford University, and University of Chicago. In the rest of this paper, the codes are referred to as ASC Codes.
- Codes from DARPA HPCS mission partners (organizations that have a vested interest in the outcome of and often financial sponsorship of the project), some of which are classified and would therefore be inaccessible to other researchers. Due to the sensitive nature of many of these projects, they must remain anonymous in this paper. In the rest of this paper, these codes are referred to as MP Codes.
|
ASC Codes |
MP Codes |
| # of projects |
5 |
5 |
| Environment |
Academia (ASC-Alliance projects) |
Mission Partners (DoD, DOE, NASA) |
| Classified |
No |
Some |
| Code size |
200-600 KLOC |
80-760 KLOC |
| Type |
Coupled multi-physics applications |
Single physics to coupled multi-physics and engineering |
Table 1. Types of projects examined.
While these case studies are still ongoing, the results to date allow for some cross-project analysis to provide a deeper understanding of the state of the practice 4 5 6 7. In this paper, we discuss some observations gained from this analysis.
Suzy Tichenor, Council on Competitiveness
1
Recent Council on Competitiveness1 studies have found that nearly all businesses that exploit high performance computing (HPC) consider it indispensable for rapid innovation, competitive advantage and corporate survival. But Council on Competitiveness research has also identified barriers to the broader use of HPC in the business sector. The companion article on high performance computing (HPC) in this issue of CTWatch Quarterly2 examined one of these barriers—the difficulty of determining the return-on-investment for HPC hardware systems (also known as supercomputers)—and proposed a methodology for addressing this issue. Another important barrier preventing greater HPC use is the scarcity of application software capable of fully exploiting current and planned HPC hardware systems.
U.S. businesses rely on a diverse range of commercially available software from independent software vendors (ISVs). At the same time, experienced HPC business users want to exploit the problem-solving power of contemporary HPC hardware systems with hundreds, thousands or (soon) tens of thousands of processors to boost innovation and competitive advantage. Yet few ISV applications today can exploit ("scale to") even 100 processors, and many of the most-popular applications scale to only a few processors in practice.
Market forces and technical challenges in recent years have caused the ISVs to pull away from creating new and innovative HPC applications, and no other source has arisen to satisfy this market need. For business reasons, ISVs focus primarily on the desktop computing markets, which are much larger and therefore promise a better return on R&D investments. ISVs can sometimes afford to make modest enhancements to their application software so that it can run faster on HPC systems, but substantially revising existing applications or creating new ones does not pay off. As a result, the software that is available for HPC systems is often outdated and incapable of scaling to the level needed to meet industry's needs for boosting problem-solving performance. In some cases, the applications that companies want simply do not exist.
This need for production-quality application software and middleware has become a soft spot in the U.S. competitiveness armor; a pacing item in the private sector’s ability to harness the full potential of HPC. Without the necessary application software, American companies are losing their ability to aggressively use HPC to solve their most challenging problems and risk ceding leadership in the global marketplace.
To better understand why U.S businesses are having difficulty obtaining the high-performance, production-quality application software they need, the Council on Competitiveness convened an HPC Users Conference, followed by a day-long software workshop held in collaboration with the Ohio Supercomputer Center (OSC). Participants3 discussed the effectiveness of current business models for HPC application software, as well as technical and resource barriers preventing the development of more effective software. They produced a roadmap of actions ISVs, universities and government research establishments could follow, individually and collectively, to address these barriers and ensure that our country has the application software needed to solve our most important competitive problems. The major discussion themes and recommendations are highlighted in the following sections.
Andrew Funk, MIT Lincoln Laboratory
Victor Basili, University of Maryland, College Park
Lorin Hochstein, University of Nebraska, Lincoln
Jeremy Kepner, MIT Lincoln Laboratory
1
Introduction
As the need for ever greater computing power begins to overtake the processor performance increases predicted by Moore’s Law, massively parallel architectures are becoming the new standard for high-end computing. As a result, programmer effort is increasingly the dominant cost driver when developing high performance computing (HPC) systems. For the end user, whereas execution time was once the primary concern, development time is now a significant factor in overall time to solution.
In the DARPA High Productivity Computer Systems (HPCS) program1 we have defined the overall system productivity, Ψ, as utility over cost:
 2
2
where utility, U(T), is a function of time. Generally speaking, the longer the time to solution, the lower the utility of that solution will be. The denominator of the formula is a sum of costs: software (CS), operator (CO), and machine (CM). A higher utility and lower overall cost lead to a greater productivity for a given system.
Previously we defined a special case that we call relative development time productivity.3 4 For the programmer, system utility is measured in terms of application performance. From the end-user’s perspective, the only relevant cost is that of software development. Thus, for the end-user developing small codes, we define productivity as:

For the case of developing parallel codes, we compare the parallel application performance to that of a baseline serial application (i.e., parallel speedup) and compare the effort required to develop the parallel application to the effort required for the serial version. Thus we define relative development time productivity (RDTP) as:

This metric has been used to analyze several parallel computing benchmark codes and graduate student programming assignments. For purposes of analysis in this paper, relative effort is defined as the parallel code size divided by the serial code size, where code size is measured in source lines of code (SLOC).5
Susan Squires, Sun Microsystems Inc.
Michael L. Van De Vanter, Sun Microsystems Inc.
Lawrence G. Votta, Sun Microsystems Inc.
1
1. Introduction
The challenge of utilizing supercomputers effectively at ever increasing scale is not being met,1 a phenomenon perceived within the high performance computing (HPC) community as a crisis of “productivity.” Acknowledging that narrow focus on peak machine performance numbers has not served HPC goals well in the past, and acknowledging that the “productivity” of a computing system is not a well-understood phenomenon, the Defense Advanced Research Project Agency (DARPA) created the High Productivity Computing Systems (HPCS) program:2
- Industry vendors were challenged to develop a new generation of supercomputers that are dramatically (10 times!) more productive, not just faster; and
- A community of vendor teams and non-vendor research institutions were challenged to develop an understanding of supercomputer productivity that will serve to guide future supercomputer development and to support productivity-based evaluation of computing systems.
The HPCS Productivity Team at Sun Microsystems responded with two commitments:
- A community of vendor teams and non-vendor research institutions were challenged to develop an understanding of supercomputer productivity that will serve to guide future supercomputer development and to support productivity-based evaluation of computing systems.
- Put the investigation of these phenomena on the soundest scientific basis possible, drawing on well-established research methodologies from relevant fields, many of which are unfamiliar within the HPC community.
Team members brought expertise from multiple research fields with a specific focus on a sound working knowledge of concepts and methods appropriate to investigating human behavior. Socio-cultural concepts such as culture, ethnography, and social network analysis are not typically well understood in the computing community, sometimes leading to re-invention of methods already developed and validated in the social sciences. The first author is a social science professional with expertise in established practice. Other research-level expertise in the team included physics (both experimental and computational), software development (both technologies and human factors), and empirical software engineering. Given the breadth of the challenge and the small team size, a first principle was that every project demands careful – and quick – determination of appropriate outcomes, project constraints, and research methods. Conclusions must be founded in data and backed by justification for the design, execution, and application. See also Kitchenham et. al. for general guidelines on conducting empirical research.3
Social scientists have developed numerous methods that are both verifiable and reproducible in many contexts. However, the sheer number of methodological options makes it crucial that each project begin with clear research goals in order to identify the most effective combinations of concepts, research designs, information sources, and methods.
The research design presented in this paper is a three-stage framework, based on the scientific method, that allows the team to draw on multiple research disciplines appropriate to the phenomena under investigation. The framework is grounded in empirical data, validated by multiple approaches (“triangulation”), and applied to the practicing HPC professionals who actually perform the work being studied.
Research findings described in this paper must be understood in the context of the framework, as described in Section 2: definitions of the stages, methods used to collect and analyze information within each stage, and the relationships among the stages. Sections 3, 4, and 5 discuss how the framework was applied to studies of the HPC software development community. Although the productivity research program is still in progress, significant findings have already contributed to the community’s understanding of HPC software
Figure 1. Research framework.
Volume 2 Number 4B
November 2006 BHigh Productivity Computing Systems and the Path Towards Usable Petascale Computing
Declan Murphy, Sun Microsystems, Inc.
Thomas Nash, Sun Microsystems, Inc.
Lawrence Votta, Jr., Sun Microsystems, Inc.
Jeremy Kepner, MIT Lincoln Laboratory
1
1. Introduction
Establishing a single, reasonably objective and quantitative framework to compare competing high productivity computing systems has been difficult to accomplish. There are many reasons for this, not the least of which is the inevitable subjective component of the concept of productivity. Compounding the difficulty, there are many elements that make up productivity and these are weighted and interrelated differently in the wide range of contexts into which a computer may be placed. Significantly improved productivity for high performance government and scientific computing is the key goal of the High Productivity Computing Systems (HPCS) program. Evaluating this critical characteristic across these contexts is clearly essential to attaining and confirming this goal.
This is not entirely a new phenomenon. Anyone who has driven a large scale computing budget request and procurement has had to address the problem of turning a set of preferences and criteria, newly defined by management, into a budget justification and a procurement figure of merit that will pass muster with agency (and OMB) auditors. The process of creating such a procurement figure of merit helps to focus the mind and cut through the complexity of competing user demands and computing options.
Imagining that we are initiating a procurement where Productivity = Utility/Cost will be the criteria, we have developed a total productivity figure of merit. This framework includes such system measurables as machine performance and reliability, developer productivity, and administration overhead and effectiveness of resource allocation. This is all in the context of information from the particular computing environment that may be proposing and procuring an HPCS computer. We note that this framework is applicable across the broad range of environments represented by HPCS mission partners and others with science and enterprise missions that are candidates for such systems.
The value of each variable in our figure of merit is intended to come from a single source, either from one of the HPCS R&D areas or from a mission organization that may procure a system. While we identify the potential source of each value, we do recognize that some of these numbers will not be easy to obtain, particularly those involving the impact of system design on human productivity. Nonetheless, we believe that, at the least, this framework will identify the individual metrics that these efforts should strive to measure. In the end, we will all have to admit that some combination of measurements, informed guesses, and subjective evaluations will be needed to arrive at a figure of merit number.
We also recognize that there is coupling between some of the variables we treat as independent. For example, a user's productivity is impacted by the way jobs are allocated. To deal with this, we suggest assuming an environment in which a particular variable is determined. This means that values for all the other variables, their “operating point,” must be specified for each measurement of a variable. 1 For measurable variables, these operating points come from measurements and studies. One could iterate to a final answer, but we argue that this is unnecessary because the effect of any such coupling, with reasonable operating point guesses, is far smaller than the precision (such as it might be) of any of the measured variables involved.
Not surprisingly, our figure of merit has much in common with ideas expressed in earlier HPCS work. 3 However, we extend beyond this in the following ways:
In a well-balanced HPCS, significant costs will be incurred for resources other than just the CPU cycles that dominate thinking in the commodity cluster architectures. In particular, memory and bandwidth resources will have cost as much or more than CPU, and efficient programs and job allocation will have to optimize use of memory and bandwidth resources as much as CPU. Our framework allows for the inclusion of any set of significantly costly resources.
A single job may be highly optimized, and those in the project it comes from will inevitably believe its utility (or value) approaches infinity. However, a computer center must optimize the total workload, given its organization's evaluation of relative priority (utility or value) for each project and job. The overall utility of the total output of the computer depends on the degree to which the allocation of system resources reflects the institution's priorities and determination of value (or utility). Further, the productivity of the administration staff depends on a system's administration environment and tools, and on its stability. 5
The remainder of this article is organized as follows. In Section 2 we define the productivity figure of merit as a combination of factors, where each factor represents a different aspect of productivity that can be evaluated relatively independently of the others. In Section 3 we show how the figure of merit captures the perspectives on productivity of people in different institutional roles and we show how productivity ratios can be used to simplify the evaluation process. In Section 4 we discuss the need for productivity benchmarking and propose the use of operating points to narrow the scope of the analysis needed for a productivity evaluation. We provide a recipe for using the figure of merit in Section 5. We conclude and describe our experience applying the figure of merit using a simple spreadsheet (available from the authors) in Section 6.
Erich Strohmaier, Lawrence Berkeley National Laboratory
1
Abstract
Performance evaluation of code execution focuses on determining performance and efficiency levels for specific application scenarios. However, there is no measure characterizing how complex it is to achieve performance and how transparent performance results are. In this paper I present an execution time metric called Performance Complexity (PC) to capture these important aspects. PC is based on performance results from a set of benchmark experiments and related performance models reflecting the behavior of a program. Residual modeling errors are used to derive PC as a measure for how transparent program performance is and how complex the performance appears to the programmer. I present a detailed description for calculating compatible P and PC values and use results from a parametric benchmark to illustrate the utility of PC for analyzing systems and programming paradigms.
1. Introduction
During the last decades it has become more difficult to achieve high performance efficiency, portability, and scalability on computer systems. It is becoming increasingly unclear how more complex hardware and software features affect performance and scalability. As we optimize our codes for particular system features, code development time increases and the achieved performance levels are less portable. Coding complexity is also increasing due to insufficient features in programming languages for parallel systems. These problems have been widely recognized and the DARPA HPCS (High Productivity Computing Systems) program is addressing them directly by funding research into new, more productive parallel programming paradigms. 1
Evaluation of code execution has traditionally focused on determining absolute and relative performance and efficiency levels for specific applications. A commonly accepted method uses a set of benchmarks selected to represent a particular workload of interest to measure absolute and relative performance. However, there is no methodology to quantify the transparency of the performance. If we understand the performance behavior of a system, performance sensitive programming is potentially easy. If performance is not transparent, programming becomes difficult and complex. Therefore, a measure for performance transparency can also be considered a measure for programming complexity.
In this paper I introduce such a code execution metric. We use the accuracy of performance models to derive a quantitative measure for Performance Complexity - PC. In the general case, a set of appropriately chosen performance models is developed for each benchmark in a benchmark set. The residual modeling errors are used to derive measures for how well performance is captured by the models. Performance Complexity is the geometric standard deviation of measured performances relative to predicted performance values.
Developing performance models for a full set of benchmarks can be time consuming As a first step, I use a single tunable synthetic benchmark Apex-MAP2 and a set of simple performance models. Different descriptive parameter value sets of Apex-MAP are used as replacement of different benchmarks. We also use a set of different performance models to study the influence of model selection on the values of PC. I find that our results reflect intuitive qualitative expectations for relative PC values surprisingly well.
The rest of this paper is organized as follows: In section 2, I introduce and describe our concept for Performance Complexity in detail, section 3 is a brief introduction to Apex-MAP, in section 4 I develop the used performance models, section 5 and 6 describe results for serial and parallel execution, section 7 discusses related work, and I present my conclusions and future work in section 8.
Andrew Funk, MIT Lincoln Laboratory
John R. Gilbert, UC Santa Barbara
David Mizell, Cray Inc.
Viral Shah, UC Santa Barbara
1
Abstract
Software development is a complex process. Many factors influence programmer productivity– experience, choice of programming language, etc. – but comparisons of their effects are primarily anecdotal. We describe a quantitative method to capture programmer workflows using timed Markov models. We fit data collected from programmers in two separate classroom experiments to these timed Markov models, and compare the workflows of programmers using UPC and C/MPI.
1. Introduction
Higher level languages such Matlab are often thought to be more productive to program in than Fortran or C. PGAS (partitioned global address space) languages are believed to be easier to use than message passing environments. There are several other widely heldbeliefs about programming and productivity; a well designed IDE might be more productive than command line tools, a debugger might be more productive than debugging by printing, interactive programming environments might allow for quicker development than compiled languages, and so on.
Such hypotheses are often anecdotal – it is hard to prove or disprove them. It should be possible to confirm or refute hypotheses about programmer productivity with a reasonable model of programming workflows coupled with experimental evidence. Quantitative analysis is desirable, but very hard to get.
We believe that our work can lead to an ability to choose a programming environment based on quantitative evaluations instead of anecdotal evidence. Several studies,1 2 3 compare different software engineering processes and programming environments in a variety of ways, mostly qualitative.
Programmers go through an identifiable, repeated process when developing programs, which can be characterized by a directed graph workflow. TMMs (timed Markov models or timed Markov processes) are one way to describe such directed graphs in a quantifiable manner. We describe a simple TMM that captures the workflows of programmers working alone on a specific problem. We then describe an experimental setup in which we instrument the student homeworks in the parallel computing class at UC Santa Barbara. We also describe the tools we developed for instrumentation, modelling, and simulating different what–if scenarios in the modelled data. Using our model and tools, we compare the workflows of graduate students programming the same assignment in C/MPI4 and UPC5> – something that is not possible without a quantitative model and measurement tools.
We describe Timed Markov Processes in Section 2. In Section 3, we describe our modelling of programmer productivity with TMM. Section 4 contains a description of our data collection methodology. We compare UPC and C/MPI data in Section 5. In Section 6, we talk about the various tools we are designing to allow anyone else to perform similar analysis. We finish with concluding remarks in Section 7.
Pedro C. Diniz, Information Sciences Institute, University of Southern California
Tejus Krishna, Information Sciences Institute, University of Southern California
1
Abstract
The standard approach to the problem of application behavior understanding relies on instruction-level instrumentation. This approach generates humongous volumes of data that overwhelm programmers in trying to understand the cause-effect relationships in their applications and thus improve the performance of their codes. This article describes an integrated compiler and run-time approach that allows the extraction of relevant program behavior information by judiciously instrumenting the source code and deriving performance metrics such as range of array reference addresses, array access stride information or data reuse characteristics. This information ultimately allows programmers to understand why the performance is what it is on a given machine as they relate to program constructs that can be reasoned about. We describe the overall organization of our compiler and run-time instrumentation system and present preliminary results for a selected set of kernel codes. The approach allow programmers to derive a wealth of information about the program behavior with a run-time overhead of less than 15% of the original code’s execution time making this attractive to instrument and analysis of code with extremely long running times where binary-level approaches are simply impractical.
1. Introduction and Motivation
Understanding the performance of modern high-performance computing machines has become notoriously difficult. These architectures expose to the programmers different hardware mechanisms that often interact in not so predictable ways. Aiming at improving their performance, programmers must resort to low-level instrumentation techniques, such as binary rewriting, to capture run-time execution data from which they hope to understand the performance behavior of the program. This approach, however, generates huge volumes of raw data at a level of abstraction that is seldom adequate for programmers to relate to the source code of their applications. Programmers are thus left guessing which style of coding is adequate for the compiler and the target architecture at hand. Worse, when one of these two components change, the learning investment is wasted, as the process must be restarted.
In this work we describe an alternative approach that relies on high-level source code instrumentation guided by the application of compiler analyses techniques. The basic idea is to judiciously instrument the application source code to extract various execution metrics that can be related to the source code. While some of the aspects of the compiler-architecture interactions are not directly modeled, the fundamental program behavior is retained at a level of abstraction that allows the compiler to relate the observed metrics to source-level program constructs programmers can understand. An added benefit exists in the isolation of the approach from the compiler effects or idiosyncrasies and thus provides a path for program behavior prediction for future architectures for which a compiler or the actual machines do not yet exist.
Consider as an illustrative example the code in Figure 1. For each invocation of the innermost loop, the computation accesses m elements of the array A with a stride of 1 and m elements of the array B with a stride that is dictated by the array size of B. There are several key observations in this example. First, the accesses to the array A and B are dependent on the range of values n and m which are not known at compile time. Second, the range of addresses to the array A are repeated across the invocations of the i loop. Finally, and although some of the values are not known, such as the actual value of k, its value is not modified throughout the execution of both loops and thus can be safely considered to be loop invariant with respect to these two loops.
for(i=0; i < n; i++){

  for(j = 0; j < m; j++){

    ... = A[k][i];

    ... = B[j][i];

  }

}
|
saveLoopBounds(loop1,0,n-1);

saveLoopBounds(loop2,0,m-1);

saveAddrRange(Ref1,A[k][0],A[k][n-1]);

for(i=0; i < n; i++){

 saveAddrRange(Ref2,B[j][i],B[m-1][i]);

  for(j = 0; j < m; j++){

    ... = A[k][j];

    ... = B[j][i];

  }

}
|
Figure 1. Illustrative example: original source code (left) and instrumented source code (right).
A way to capture the behavior of the program in more detail is to instrument it at the source-code level as shown on the right-hand-side of figure 1. Here we have augmented the original code with calls to instrumentation functions with the appropriate arguments. For instance, saveAddrRange(Ref1,A[k][0],A[k][N-1])will record that, at the particular execution point in the program, the range defined by the two arguments A[k][0],A[k][n-1]will be accessed m times. In this particular instrumentation, we are taking advantage of the fact that the range of addresses is clearly invariant with respect to the i-loop and thus can be hoisted outside the two loops. In this example the loop bounds are symbolically constant and the array access functions are affine with respect to the loop index variables. In the end with the results obtained by this instrumentation, we can learn valuable information regarding the range of addresses the computation accesses and/or the access patterns and thus locality of reference.
Many other authors have addressed the problem of understanding and quantifying the amount of reuse in applications. In the context of scientific application codes, such as the SpecFP benchmark suite, Sherwood et. al. 1 developed a low-level instruction instrumentation approach that identifies the phases of a given computation in terms of the similarities between executed instructions. Other authors have focused on cache locality metrics (e.g., 2 3 4) whereas other use temporal reuse distance or stack distances.5 6 Weinberg et. al.7 have implemented the locality scores described in this document using at a very low-level instrumentation approach.
All these efforts have in common the fact that they instrument the addresses and instruction issued by a running executable directly at a very low-level.8 9 10 11 They offer the promise of high precision, provided one can cope with the enormous data volume they generate or the substantial application slowdown. The approach described in this document explores the opposite end of the instrumentation spectrum. It does not rely on low-level instrumentation, but on high-level source code instrumentation. This approach is faster but comes at a loss in precision, with the additional handicap that it does not take into account the compiler effects – how the compiler has modified the generated code to included hardware-oriented execution transformations such as pre-fetching or speculation. The fundamental premise of this work is that it is possible with little source level instrumentation overhead to capture a large amount of program execution information.
Sadaf R. Alam, Oak Ridge National Laboratory
Nikhil Bhatia, Oak Ridge National Laboratory
Jeffrey S. Vetter, Oak Ridge National Laboratory
1
1. Introduction
Performance and workload modeling have numerous uses at every stage of the high-end computing lifecycle: design, integration, procurement, installation, tuning, and maintenance. Despite the tremendous usefulness of performance models, their construction remains largely a manual, complex, and time-consuming exercise. Many of these techniques serve the overall purpose of modeling but few common techniques have gained widespread acceptance across the community. In most cases, researchers create models by manually interrogating applications with an array of performance, debugging, and static analysis tools to refine the model iteratively until the predictions fall within expectations. In other cases, researchers start with an algorithm description, and develop the performance model directly from this abstract description. In particular, DARPA’s High Productivity Computing Systems (HPCS) program requires understanding and predicting application requirements almost eight years in advance, when prototype hardware and perhaps even system simulators do not exist. In this light, performance modeling takes on a critical importance because system architects must make choices that match application workloads while DARPA and its HPCS mission partners must set aggressive but realistic goals for performance.
In this article, we describe a new approach to performance model construction, called modeling assertions (MA), which borrows advantages from both the empirical and analytical modeling techniques1 2. This strategy has many advantages over traditional methods: isomorphism with the application structure; easy incremental validation of the model with empirical data; uncomplicated sensitivity analysis; and straightforward error bounding on individual model terms. We demonstrate the use of MA by designing a prototype framework, which allows construction, validation, and analysis of models of parallel applications written in FORTRAN and C with the MPI communication library. We use the prototype to construct models of NAS CG, SP benchmarks3 and a production level scientific application called Parallel Ocean Program (POP).4
A further advantage of our approach is that the MA symbolic models encapsulate an application’s key input parameters as well as the workload parameters, including the computation and the communication characteristics of the modeled applications. The MA scheme requires an application developer to describe the workload requirements of a given block of code using the MA API in the form of code annotations. These code annotations are independent of the target platforms. Moreover, the MA scheme allows multi-resolution modeling of scientific applications. In other words, a user can decide which functions are critical to a given application and can annotate and subsequently develop detailed performance models of the key functions. Depending on the runtime accuracy of the model, a user can develop hierarchical, multi-resolution performance models of selected functions, for instance, models of critical loop blocks within a time-consuming function. MA models can capture the control structure of an application. Thus, not only an aggregated workload metric is generated, but also the distribution of a given workload over an entire execution cycle can be modeled using the MA framework.
The outline of the paper is as follows: the motivation behind the modeling assertion technique is presented in section 2. Section 3 explains the components of the Modeling Assertions framework. Section 4 describes model construction and validation using the NAS CG benchmarks. Section 5 presents the scalability of the NAS CG and SP benchmarks and POP communication behavior together with an analysis of sensitivity of workload requirements. Section 6 concludes with benefits and contributions of the modeling assertions approach to performance modeling studies.
David A. Bader, Georgia Institute of Technology
Kamesh Madduri, Georgia Institute of Technology
John R. Gilbert, UC Santa Barbara
Viral Shah, UC Santa Barbara
Jeremy Kepner, MIT Lincoln Laboratory
Theresa Meuse, MIT Lincoln Laboratory
Ashok Krishnamurthy, Ohio State University
1
Abstract
One of the main objectives of the DARPA High Productivity Computing Systems (HPCS) program is to reassess the way we define and measure performance, programmability, portability, robustness and ultimately productivity in the High Performance Computing (HPC) domain. This article describes the Scalable Synthetic Compact Applications (SSCA) benchmark suite, a community product delivered under support of the DARPA HPCS program. The SSCA benchmark suite consists of six benchmarks. The first three SSCA benchmarks are specified and described in this article. The last three are to be developed and will relate to simulation. SSCA #1 Bioinformatics Optimal Pattern Matching stresses integer and character operations (no floating point required) and is compute-limited; SSCA #2 Graph Analysis stresses memory access, uses integer operations, is compute-intensive, and is hard to parallelize on most modern systems; and SSCA #3 Synthetic Aperture Radar Application is computationally taxing, seeks a high rate at which answers are generated, and contains a significant file I/O component. These SSCA benchmarks are envisioned to emerge as complements to current scalable micro-benchmarks and complex real applications to measure high-end productivity and system performance. They are also described in sufficient detail to drive novel HPC programming paradigms, as well as architecture development and testing. The benchmark written and executable specifications are available from www.highproductivity.org.
1. Introduction
One of the main objectives of the DARPA High Productivity Computing Systems (HPCS) program1 is to reassess the way we define and measure performance, programmability, portability, robustness and ultimately productivity in the High Performance Computing (HPC) domain. An initiative in this direction is the formulation of the Scalable Synthetic Compact Applications (SSCA)2 benchmark suite. Each SSCA benchmark is composed of multiple related kernels which are chosen to represent workloads within real HPC applications and is used to evaluate and analyze the ease of use of the system, memory access patterns, communication and I/O characteristics. The benchmarks are relatively small to permit productivity testing and programming inreasonable time; and scalable in problem representation and size to allow simulating a run at small scale or executing on a large system at large scale.
Each benchmark written specification presents detailed background and parameters for an untimed data generator and a number of timed application kernels. All of the SSCA benchmarks are intended to be scalable using any of a variety of techniques, a variety of languages, and a variety of machine architectures. Each SSCA includes a number of untimed validation steps to provide checks an implementor can make to gain confidence in the correctness of the implementation.
The SSCA benchmark suite consists of six benchmarks. The first three SSCA benchmarks are specified and described in this article. The last three are to be developed and will relate to simulation.
- Bioinformatics Optimal Pattern Matching: This benchmark focuses on sequence alignment algorithms in computational biology. It stresses integer and character operations, and requires no floating point operations. It is compute-limited, and most of the kernels are embarrassingly parallel. (Section 2)
- Graph Analysis: SSCA #2 is a graph theory benchmark representative of computations in informatics and national security. It is characterized by integer operations, a large memory footprint, and irregular memory access patterns. It is also relatively harder toparallelize compared to the other two SSCAs.
(Section 3)
- Synthetic Aperture Radar Application: This benchmark is characteristic of the computations, communication, and taxing data I/O requirements that are found in many types of sensor processing chains. SSCA #3’s principal performance goal is throughput, or in other words, the rate at which answers are generated. The benchmark stresses large block data transfers and memory accesses, and small I/O.
(Section 4)
Pages: 1 2 3 4 5 6 7 8 9 10
Pedro C. Diniz, Information Sciences Institute, University of Southern California
Jeremy Abramson, Information Sciences Institute, University of Southern California
1
Abstract
The lack of tools that can provide programmers with adequate feedback at a level of abstraction the programmers can relate to makes the problem of performance prediction and thus of performance portability in today’s or tomorrow’s machines extremely difficult. This paper describes SLOPE – the Source Level Open64 Performance Evaluator. SLOPE uses an approach to the problem of performance prediction and architecture sensitivity analysis using source level program analysis and scheduling techniques. In this approach, the compiler extracts the computation’s high-level data-flow-graph information by inspection of the source code. Taking into account the data access patterns of the various references in the code the tool uses a list-scheduling algorithm to derive performance bounds for the program under various architectural scenarios. The end result is a very fast prediction of what the performance could be but, more importantly, the reasoning of why the predicted performance is what it is. We have experimented with a real code that engineers and scientists use in practice. The results yield important qualitative performance sensitivity information that can be used when allocating computing resources to the computation in a judicious fashion for maximum resource efficiency and/or help guide the application of compiler transformations such as loop unrolling.
1. Introduction and Background
Modern, high-end computers present a complex execution environment that makes performance understanding and performance portability extremely difficult. Programmers go to extreme lengths to manually apply various high-level transformations, most notably loop-unrolling, in an attempt to expose more Instruction-Level-Parallelism (ILP) and thus take advantage of micro architecture features such as pipelining, super-scalar and multi-core characteristics. The lack of performance prediction and analysis tools that can provide feedback to the programmer about the performance leaves the programmer in an uncomfortable position. Without understanding why the performance is what it is, the programmer is forced to search for the best possible transformation sequences by trial and error. Furthermore, existing performance understanding tools provide feedback at a very low level of abstraction, such as cache miss rates or clocks-per-clock-cycle providing no clue as to what the bottlenecks that lead to such metric values are.
Earlier approaches to performance modeling and understanding were purely empirical. Researchers developed representative kernel codes of large-scale applications such as the NAS Parallel1 and the SPEC.2 By observing the performance of these kernels on a given machine one could extrapolate in a qualitative fashion, the performance behavior of a real application. More recently researchers have developed models for the performance of parallel applications by examining its memory behavior.3 4 Other work has focused on modeling the behavior of an application by first accurately characterizing the running time of the sequential portions of the application using analytical modeling based on intimate knowledge of the applications mathematics and empirical observations to extract the corresponding parameter values.5 On the other end of the spectrum, cycle-level simulators for architecture performance understanding at a very low level are simply too slow for realistic workloads. As a result, the simulations tend to focus on a minute subset of the instruction stream or use sampling techniques, and are thus limited to very focused architectural analyses.
This article describes an alternative approach to the problem of performance prediction and architecture sensitivity analysis using source level program analysis and scheduling techniques. In this approach, the compiler first isolates the basic blocks of the input source program and extracts the corresponding high-level data-flow-graph (DFG) information. It then uses the high-level information about the data access patterns of array references to determine the expected latency of memory operations. Once the DFG of each basic block, most notably the ones in the body of nested loops is extracted, the compiler tool uses a list-scheduling algorithm to determine the execution time of the computation. This scheduling makes use of the DFG as well as the functional resources available in the architecture like the number of load/store or functional units and for specific operation latency values.
While this approach has the advantage of being less sensitive to the specific details of an existing machine and not taking into account, with accuracy, the effects of a given compiler, it offers other benefits that instruction-level instrumentation-based performance analysis tools cannot offer. First, it is much closer to the source code and thus can provide feedback to the programmer about which operations (not necessarily instructions) can lead to performance bottlenecks. For example, if the schedule reveals that an indirect array access is accessed randomly, it can determine that this load operation will exhibit a high memory latency and thus stall the pipelining of a functional unit. Under these scenarios the compiler can notify the programmer of the operations that are very likely to cause severe performance degradation. Second, and because it operates at a much higher level we do not require any sort of lengthy low-level instrumentation that requires the code to be executed to extract (sampled) traces. Finally, we are free to emulate future architecture features, such as dedicated custom functional units (e.g., gather-scatter unit), or even emulate some operations in memory by assigning specific costs to specific subsets of the DFG in a computation.
We have experimented with this approach using UMT2K, a synthetic kernel modeled after a real physics photon transport code. 6 Using this computational kernel, our tool determines qualitatively that in the absence of loop unrolling no more than two functional arithmetic units are needed to attain a level of performance that is consistent with the critical path of the computation. When the core is unrolled by a factor of four, no more than four functional arithmetic units are needed. In the context of a multi-core architecture, this information would allow a compiler to schedule and adapt its run-time execution strategy to unroll just the required amount depending on the available units.
The rest of this article is organized as follows. In the next section we describe in more detail the technical approach of our tool and how it allows performance predictions, and we perform architectural sensitivity analysis. Section 3 presents the experimental results for our case study application – the UMT2K kernel code. We present concluding remarks in section 4.
Tzu-Yi Chen, Pomona College
Meghan Gunn, University of San Diego
Beth Simon, UC San Diego
Laura Carrington, San Diego Supercomputer Center
Allan Snavely, San Diego Supercomputer Center
1
Abstract
We introduce a metric for evaluating the quality of any predictive ranking and use this metric to investigate methods for answering the question: How can we best rank a set of supercomputers based on their expected performance on a set of applications? On modern supercomputers, with their deep memory hierarchies, we find that rankings based on benchmarks measuring the latency of accesses to L1 cache and the bandwidth of accesses to main memory are significantly better than rankings based on peak flops. We show how to use a combination of application characteristics and machine attributes to compute improved workload-independent rankings.
1. Introduction
Low-level performance metrics such as processor speed and peak floating-point issue rate (flops) are commonly reported, appearing even in mass-market computer advertisements. The implication is that these numbers can be used to predict how fast applications will run on different machines,
so faster is better. More sophisticated users realize that manufacturer specifications such as theoretical peak floating-point issue rates are rarely achieved in practice, and so may instead use simple benchmarks to predict relative application performance on different machines. For understanding parallel performance, benchmarks range from scaled down versions of real applications to simpler metrics (e.g., the NAS parallel benchmark suites,1 the SPEC benchmark,2 the HINT benchmark,3 the HPC Challenge benchmark,4 STREAM,5 and the ratio of flops to memory bandwidth6).
A particularly well-known parallel benchmark is Linpack,7 which has been used since 1993 to rank supercomputers for inclusion on the Top 500 list8(more recently the IDC Balanced Rating9 has also been used to rank machines). The Top 500 list is popular partly because it is easy to read, is based on a simple metric that is easy to measure (essentially peak flops), and is easy to update. Unfortunately, such benchmarks have also been found insufficient for accurately predicting runtimes of real applications.10

Figure 1. This graph shows the measured runtimes of eight applications on seven supercomputers. The runtime for each application is divided by the maximum time taken by any of the entire set of 14 machines to run that application.
The reason is clear. Consider Figure 1, which plots the performance of eight different High Performance Computing (HPC) codes on seven different supercomputers. The codes are a subset of those in Table 4; the machines are a subset of those in Table 5 (both in Appendix). For each application, all the running times are normalized by the slowest time over all the machines. Since the machines shown are only a subset of those on which we collected runtimes, the highest bar is not at one for every application. While some machines are generally faster than others, no machine is fastest (or slowest) on all the applications. This suggests performance is not a function of any single metric.
D. E. Post, DoD High Performance Computing Modernization Program
R. P. Kendall, Carnegie Mellon University Software Engineering Institute
1
Overview
Computational science and engineering (CSE) is becoming an important tool for scientific research and development and for engineering design. It is being used to make new scientific discoveries and predictions, to design experiments and analyze the results, to predict operational conditions, and to develop, analyze and assess engineering designs. Each application generally requires a different type of application program, but there are important common elements. As computer power continues to grow exponentially, the potential for CSE to address many of the most crucial problems of society increases as well. The peak power of the next generation of computers will be in the range of 1015 floating point operations per second achieved with hundreds of thousands of processors. It is becoming possible to run applications that include accurate treatments of all of the scientific effects that are known to be important for a given application. However, as the complexity of computers and application programs increases, the CSE community is finding it difficult to develop the highly complex applications that can exploit the advances in computing power. We are facing the possibility that we will have the computers but we may not be able to quickly and more easily develop large-scale applications that can exploit the power of those computers.
In support of the Defense Advanced Research Projects Agency’s High Productivity Computing Systems Program (DARPA HPCS) to reduce these software difficulties, we have conducted case studies of many large scale CSE projects and identified the key steps involved in developing and using CSE tools.1 This information is helping the computer architects for the DARPA HPCS computers understand the processes involved in developing and using large-scale CSE projects, and identify the associated bottlenecks and challenges. This has facilitated their efforts to develop and implement productivity improvements in computer architectures and in the software support infrastructure. This information can also used as a blueprint for new projects.
While CSE workflows share many features with traditional Information Technology (IT) software project workflows, there are important differences. IT projects generally begin with the specification of a detailed set of requirements.2 The requirements are used to plan the project. In contrast, it is generally impossible to define a precise set of requirements and develop a detailed software design and workplan for the development and application of large-scale CSE projects. This is not because CSE projects have no requirements. Indeed, the requirements for CSE projects, the laws of nature, are very definite and are not flexible. The challenge computational scientists and engineers face is to develop and apply new computational tools that are instantiations of these laws. CSE applications generally address new phenomena. Because they address new issues, they often exhibit new and unexpected behavior. Successful projects identify the properties of nature that are most important for the phenomena being studied and develop and implement computational methods that accurately simulate those properties. The initial set of candidate algorithms and effects usually turns out to be inadequate and new ones have to be developed and implemented. Successful code development is thus a “requirements discovery” process. For these reasons, the development and use of CSE projects is a complex and highly iterative process. While it is definitely not the waterfall model, it does share some of the features of more modern software engineering workflows such as the “spiral” development model.2
Reference this article "Large-Scale Computational Scientific and Engineering Project Development and Production Workflows,"
CTWatch Quarterly, Volume 2, Number 4B,
November 2006 B. http://www.ctwatch.org/quarterly/articles/2006/11/large-scale-computational-scientific-and-engineering-project-development-and-production-workflows/


