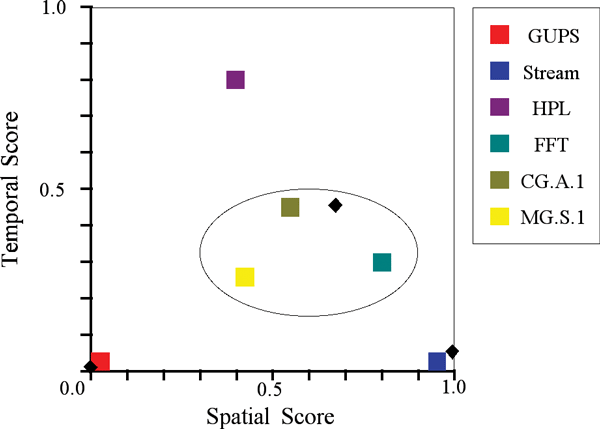
As an application of these static and run-time instrumentation techniques, we now describe a specific program behavior model - locality metrics. In particular, we are interested in computing a temporal and spatial locality metric that can quantitatively distinguish between programs with distinct memory access pattern behaviors and thus distinct memory hierarchy performance.
A program will exhibit high spatial locality if it tends to visit memory locations that are close to each other in space. For instance, if a program accesses the data organized as an array with a stride of 1, it exhibits very high spatial locality. If the memory access patterns are very random, its spatial locality is low. Conversely, a program will exhibit a high temporal locality if it tends to repeatedly revisit the same memory locations in a small window of accesses. Given these loose concepts in a computation, we plot the memory access behavior of a computation on a two-dimensional axis normalized between zero and one on both temporal and spatial locality axis as depicted in figure 4. A computation that randomly accesses memory will exhibit both very low spatial and very low temporal locality, and will therefore be plotted in the corner of the diagram close to the origin. A computation that scans an extremely large portion of the memory in a stride 1 array access pattern and that never revisits the same location will have high spatial locality but low temporal locality. On the other hand, a computation that revisits data often and scans the memory using a unit stride, as is the case with common matrix-matrix computations, will exhibit high temporal and spatial localities and thus be close to the (1,1) corner of the diagram. Finally, it is possible to conceive a computation that has very random behavior but revisits the same randomly visited locations often. This computation will have high temporal locality but low spatial locality.

These concepts of spatial and temporal locality have been recently explored by Weinberg et. al.,7 who developed a series of scoring metrics to approximate more rigorous definitions of spatial and temporal locality. The implementation of their spatial and temporal locality scores is very expensive and calls for the analysis of every memory access a computation issues to determine if the specific location has been visited in the past and if so, how long ago. They also classify the various data access streams trying to uncover the stride information as they define a spatial score as a direct function of the stride associated with a given data stream.
In this work, we define two scoring metrics for the spatial and temporal localities of access streams generated by array references. A stream generated by an array reference that traverses a range of addresses from a lower bound (lb) to an upper bound (ub) with stride (st) exhibits a spatial locality of 1/st. Thus a unit stride walk through the elements of an array will correspond to a 1.0 spatial locality scoring and an increasingly longer stride will lead to very low score values. A random scan of the array locations will lead to a spatial score of zero. Intuitively, this model matches the cost model of a cache-supported memory hierarchy, as shorter strides will increase the likelihood of a given data item being on the cache due to the line-size effects. In this work, we use the average stride information that the run-time instrumentation uncovers by using the static and dynamic information to compute a weighted sum over all basic blocks of the spatial locality score, as given below. The weights are simply the relative frequency with which each basic block is executed.


The choice of metric to use to capture temporal reuse is far from being widely accepted. A naïve approach relies on keeping track of every accessed address and determining upon a match the distance, in terms of the number of accesses, between repeating address locations. Use of this approach at the lowest level of instrumentation makes this an infeasible approach as suggested by Snavely et. al.,7 where the authors report application slowdowns in the range of 10x to 20x. This effectively limits the scope of the instrumentation and forces the implementation to rely on sampling techniques for feasibility.
Instead, we rely on high-level source code instrumentation and program analysis to reduce the number of array references that are instrumented. In our own experiments, we observed a slowdown in the order of 15% much lower than the slowdown reported by the lower-level instrumentation techniques. Specifically, we use the temporal scoring expression shown below as reported originally in Weinberg et. al.7 In this scoring, temporal locality is seen as a weighted sum of the fraction of the dynamic references that exhibit a reuse distance of 2i for decreasing weights with the increased reuse distance. The weight factor Weight(i) of (log2(N) – i)/log2(N) for references with a reuse distance of 2i gives a higher weight to references with a smaller reuse distances and much less to increasing reuse distances. The implementation simply keeps track of how many references do exhibit a reuse of increasingly larger values (as powers of 2) and keeps track of the number of memory references.


