CTWatch
November 2007
Software Enabling Technologies for Petascale Science
Fred Johnson, Acting Director, Computational Science Research & Partnerships (SciDAC) Division
Office of Advanced Scientific Computing Research
DOE Office of Science

1

The critical importance of enabling software technology for leading edge research is being thrown into sharp relief by the remarkable escalation in the application complexity, quantities of data that scientists must now grapple with, and the scale of the computing platforms that they must use to do it. The effects of this ongoing complexity and data tsunami as well as the drive toward petascale computing are reverberating throughout every level of the software environment on which today’s vanguard applications depend – through the algorithms, the libraries, the system components, and the diverse collection of tools and methodologies for software development, performance optimization, data management, and data visualization. It is increasingly clear that our ability today to adapt and scale up the elements of this common software foundation will largely determine our ability tomorrow to attack the questions emerging at the frontiers of science.

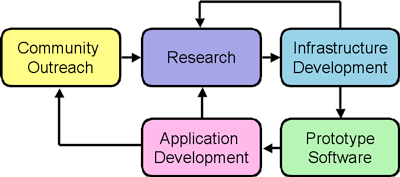
Nowhere is this connection between scalable software technology and breakthrough science more evident than in the articles of this issue of CTWatch Quarterly. Each one offers an informative and stimulating discussion of some of the major work being carried out by one of the Centers for Enabling Technologies (CET) of the Department of Energy’s wide ranging and influential SciDAC program. The joint mission of the CETs is to assure that the scientific computing software infrastructure addresses the needs of SciDAC applications, data sets and parallel computing platforms, and to help prepare the scientific community for an environment where distributed, interdisciplinary collaboration is the norm. Each CET is a multidisciplinary team that works closely with one or more of SciDAC’s major application teams. Each one focuses its attention on the mathematical and computing problems confronting some major aspect of software functionality, such as distributed data management, application development, performance tuning, or scientific visualization. Making necessary progress in any of these areas requires the collective effort from the national (and international) research community, yet as these articles show, working in the context of SciDAC research has enabled these CETs to make leadership contributions.

The articles here reflect the rich diversity of components, layers and perspectives encompassed by SciDAC’s software ecosystem. They are grouped together according to the aspect of the problem of scalability they address. One group of articles focuses on the software innovations that will be necessary to cope with multiple order of magnitude increases in the number of processors and processor cores on petascale systems and beyond; another set focuses on the data management challenges spawned by the exponential growth in the size of tomorrow’s routine data sets; and finally, CETs dedicated to scientific visualization address the need to understand increasingly large and complex data sets generated either experimentally or computationally. The articles in this issue of CTWatch Quarterly follow these groupings.

Pages: 1 2 3

Garth Gibson, Carnegie Mellon University
Bianca Schroeder, Carnegie Mellon University
Joan Digney, Carnegie Mellon University

1
Introduction

Three of the most difficult and growing problems in future high-performance computing (HPC) installations will be avoiding, coping and recovering from failures. The coming PetaFLOPS clusters will require the simultaneous use and control of hundreds of thousands or even millions of processing, storage, and networking elements. With this large number of elements involved, element failure will be frequent, making it increasingly difficult for applications to make forward progress. The success of petascale computing will depend on the ability to provide reliability and availability at scale.

While researchers and practitioners have spent decades investigating approaches for avoiding, coping and recovering from abstract models of computer failures, the progress in this area has been hindered by the lack of publicly available, detailed failure data from real large-scale systems.

We have collected and analyzed a number of large data sets on failures in high-performance computing (HPC) systems. Using these data sets and large scale trends and assumptions commonly applied to future computing systems design, we project onto the potential machines of the next decade our expectations for failure rates, mean time to application interruption, and the consequential application utilization of the full machine, based on checkpoint/restart fault tolerance and the balanced system design method of matching storage bandwidth and memory size to aggregate computing power.1

Not surprisingly, if the growth in aggregate computing power continues to outstrip the growth in per-chip computing power, more and more of the computer’s resources may be spent on conventional fault recovery methods. For example, we envision applications being denied as much as half of the system’s resources in five years.2 The alternatives that might compensate for this unacceptable trend include application-level checkpoint compression, new special checkpoint devices or system level process-pairs fault-tolerance for supercomputing applications.

Our interest in large-scale cluster failure stems from our role in a larger effort, the DOE SciDAC-II Petascale Data Storage Institute (PDSI), chartered to anticipate and explore the challenges of storage systems for petascale computing.3 In as much as checkpoint/restart is a driving application for petascale data storage systems, understanding node failure and application failure tolerance is an important function for the PDSI. To increase the benefit of our data collection efforts, and to inspire others to do the same, we are working with the USENIX Association to make publicly available these and other datasets in a Computer Failure Data Repository (CFDR).4 Systems researchers and developers need to have ready access to raw data describing how computer failures have occurred on existing large-scale machines.

Pages: 1 2 3 4 5 6 7

Steven Parker, University of Utah
Rob Armstrong, Sandia National Laboratory
David Bernholdt, Oak Ridge National Laboratory
Tamara Dahlgren, Lawrence Livermore National Laboratory
Tom Epperly, Lawrence Livermore National Laboratory
Joseph Kenny, Sandia National Laboratory
Manoj Krishnan, Pacific Northwest National Laboratory
Gary Kumfert, Lawerence Livermore National Laboratory
Jay Larson, Argonne National Laboratory
Lois Curfman McInnes, Argonne National Laboratory
Jarek Nieplocha, Pacific Northwest National Laboratory
Jaideep Ray, Sandia National Laboratory
Sveta Shasharina, Tech-X Corporation

1
Overview

The SciDAC Center for Technology for Advanced Scientific Computing Software (TASCS) focuses on developing tools, components and best practices for developing high quality, reusable high-performance computing software. TASCS fosters the Common Component Architecture (CCA) through a community forum that involves a wide range of participants. The CCA environment aims to bring component-based software development techniques and tools, which are commonplace in the computing industry, to high performance computing. To do so, several challenges are being addressed including parallelism, performance, and efficient handling of large datasets. The CCA has produced a specification that allows components to be deployed and reused in a highly extensible yet efficient parallel environment. The primary advantage of this component-based approach is the separate development of simulation algorithms, models, and infrastructure. This allows the pieces of a complex simulation to evolve independently, thereby helping a system grow intelligently as technologies mature. The CCA tools have been used to improve productivity and increase capabilities for HPC software in meshing, solvers, and computational chemistry, among other applications.

TASCS supports a range of core technologies for using components in high-performance simulation software, including the Caffeine framework, the Babel interoperability tool, and the Bocca development environment for HPC components. In addition, the CCA helps provide access to tools for performance analysis, for coupling parallel simulations, for mixing distributed and parallel computing, and for ensuring software quality in complex parallel simulations. These tools can help tame the complexity of utilizing parallel computation, especially for sophisticated applications that integrate multiple software packages, physical simulation regimes or solution techniques. We will discuss some of these tools and show how they have been used to solve HPC programming challenges.

Pages: 1 2 3 4 5 6

David H. Bailey, Lawrence Berkeley National Laboratory
Robert Lucas, University of Southern California
Paul Hovland, Argonne National Laboratory
Boyana Norris, Argonne National Laboratory
Kathy Yelick, Lawrence Berkeley National Laboratory
Dan Gunter, Lawrence Berkeley National Laboratory
Bronis de Supinski, Lawrence Livermore National Laboratory
Dan Quinlan, Lawrence Livermore National Laboratory
Pat Worley, Oak Ridge National Laboratory
Jeff Vetter, Oak Ridge National Laboratory
Phil Roth, Oak Ridge National Laboratory
John Mellor-Crummey, Rice University
Allan Snavely, University of California, San Diego
Jeff Hollingsworth, University of Maryland
Dan Reed, University of North Carolina
Rob Fowler, University of North Carolina
Ying Zhang, University of North Carolina
Mary Hall, University of Southern California
Jacque Chame, University of Southern California
Jack Dongarra, University of Tennessee, Knoxville
Shirley Moore, University of Tennessee, Knoxville

1
1. Introduction

Understanding and enhancing the performance of large-scale scientific programs is a crucial component of the high-performance computing world. This is due not only to the increasing processor count, architectural complexity and application complexity that we face, but also due to the sheer cost of these systems. A quick calculation shows that if one can increase by just 30% the performance of two of the major SciDAC1 applications codes (which together use, say, 10% of the NERSC and ORNL high-end systems over three years), this represents a savings of some $6 million.

Within just five years, systems with one million processors are expected, which poses a challenge not only to application developers but also to those engaged in performance tuning. Earlier research and development by us and others in the performance research area focused on the memory wall – the rising disparity between processor speed and memory latency. Now the emerging multi-core commodity microprocessor designs, with many processors on a single chip and large shared caches, create even greater penalties for off-chip memory accesses and further increase optimization complexity. With the release of systems such as the Cray X1, custom vector processing systems have re-emerged in U.S. markets. Other emerging designs include single-instruction multiple-data (SIMD) extensions, field-programmable gate arrays (FPGAs), graphics processors and the Sony-Toshiba-IBM Cell processor. Understanding the performance implications for such diverse architectures is a daunting task.

In concert with the growing scale and complexity of systems is the growing scale and complexity of the scientific applications themselves. Applications are increasingly multilingual, with source code and libraries created using a blend of Fortran 77, Fortran-90, C, C++, Java, and even interpreted languages such as Python. Large applications typically have rather complex build processes, involving code preprocessors, macros and make files. Effective performance analysis methodologies must deal seamlessly with such structures. Applications can be large, often exceeding one million lines of code. Optimizations may be required at many locations in the code, and seeming local changes can affect global data structures. Applications are often componentized and performance can depend significantly on the context in which the components are used. Finally, applications increasingly involve advanced features such as adaptive mesh refinement, data intensive operations and multi-scale, multi-physics and multi-method computations.

The PERI project emphasizes three aspects of performance tuning for high-end systems and the complex SciDAC applications that run on them: (1) performance modeling of applications and systems; (2) automatic performance tuning; and (3) application engagement and tuning. The next section discusses the modeling activities we are undertaking both to understand the performance of applications better and to be able to determine what are reasonable bounds on expected performance. Section 3 presents the PERI vision for how we are creating an automatic performance tuning capability, which ideally will alleviate scientific programmers of this burden. Automating performance tuning is a long-term research project, and the SciDAC program has scientific objectives that cannot await its outcome. Thus, as Section 4 discusses, we are engaging with DOE computational scientists to address today’s most pressing performance problems. Finally, Section 5 summarizes the current state of the PERI SciDAC-2 project.

Pages: 1 2 3 4

John Mellor-Crummey, Rice University
Peter Beckman, Argonne National Laboratory
Keith Cooper, Rice University
Jack Dongarra, University of Tennessee, Knoxville
William Gropp, Argonne National Laboratory
Ewing Lusk, Argonne National Laboratory
Barton Miller, University of Wisconsin, Madison
Katherine Yelick, University of California, Berkeley

1
1. Center for Scalable Application Development Software

The Department of Energy’s (DOE) Office of Science is deploying leadership computing facilities, including a Blue Gene/P system at Argonne National Laboratory and a Cray XT system at Oak Ridge National Laboratory, with the aim of catalyzing scientific discovery. These emerging systems composed of tens of thousands of processor cores are beginning to provide immense computational power for scientific simulation and modeling. However, harnessing the capabilities of such large-scale microprocessor-based, parallel systems is daunting for application developers. A grand challenge for computer science is to develop software technology that simplifies using such systems.

To help address this challenge, in January 2007 the Center for Scalable Application Development Software (CScADS)1 was established as a partnership between Rice University, Argonne National Laboratory, University of California – Berkeley, University of Tennessee – Knoxville, and University of Wisconsin – Madison. As part of the DOE’s Scientific Discovery through Advanced Computing (SciDAC) program, CScADS is pursuing an integrated set of activities that aim to increase the productivity of DOE computational scientists by catalyzing the development of software tools and libraries for leadership computing platforms. These activities include workshops to engage the research community in the challenges of leadership-class computing, research and development of open-source software, and work with computational scientists to help them develop codes for leadership computing platforms.

Figure 1


Figure 1. Relationship between CScADS activities.

Figure 1 illustrates the relationships between the Center’s activities. The flow of ideas originates from two sources: workshops for community outreach and vision-building, and direct involvement with application development. These activities focus research efforts on important problems. In turn, research drives the infrastructure development by identifying capabilities that are needed to support the long-range vision. Infrastructure feeds back into the research program, but also supports prototyping of software tools that support further application development. Finally, experiences by developers using prototype compilers, tools and libraries will spur the next cycle of research and development.

First, we briefly describe each of the Center’s activities in a bit more detail. Then, we describe the themes of CScADS research. Finally, we conclude with a brief discussion of ongoing work.

Pages: 1 2 3 4 5 6

E. Wes Bethel, Lawrence Berkeley National Laboratory
Chris Johnson, University of Utah
Cecilia Aragon, Lawrence Berkeley National Laboratory
Prabhat, Lawrence Berkeley National Laboratory
Oliver Rübel, Lawrence Berkeley National Laboratory
Gunther Weber, Lawrence Berkeley National Laboratory
Valerio Pascucci, Lawrence Livermore National Laboratory
Hank Childs, Lawrence Livermore National Laboratory
Peer-Timo Bremer, Lawrence Livermore National Laboratory
Brad Whitlock, Lawrence Livermore National Laboratory
Sean Ahern, Oak Ridge National Laboratory
Jeremey Meredith, Oak Ridge National Laboratory
George Ostrouchov, Oak Ridge National Laboratory
Ken Joy, University of California, Davis
Bernd Hamann, University of California, Davis
Christoph Garth, University of California, Davis
Martin Cole, University of Utah
Charles Hansen, University of Utah
Steven Parker, University of Utah
Allen Sanderson, University of Utah
Claudio Silva, University of Utah
Xavier Tricoche, University of Utah

1
Introduction

Galileo Galilei (15 February 1564 -- 8 January 1642) has been credited with fundamental improvements to early telescope designs that resulted in the first practically usable instrument for observing the heavens. With his “invention,” Galileo went on to many notable astronomical discoveries: the satellites of Jupiter, sunspots and the rotation of the sun, and proved the Copernican heliocentric model of the solar system (where the sun, rather than the earth, is the center of the solar system). These discoveries, and their subsequent impact on science and society, would not have been possible without the aid of the telescope – a device that serves to transform the unseeable into the seeable.

Modern scientific visualization, or just visualization for the sake of brevity in this article, plays a similarly significant role in contemporary science. Visualization is the transformation of abstract data, whether it be observed, simulated, or both, into readily comprehensible images. Like the telescope and other modern instruments, visualization has proven to be an indispensable part of the scientific discovery process in virtually all fields of study. It is largely accepted that the term “scientific visualization” was coined in the landmark 1987 report1 that offered a glimpse into the important role visualization could play in scientific discovery.

Visualization produces a rich and diverse set of output – from the x/y plot to photorealistic renderings of complex multidimensional phenomena. It is most typically “reduced to practice” in the form of software. There is a strong, vibrant, and productive worldwide visualization community that is inclusive of commercial, government and academic interests.

The field of visualization is as diverse as the number of different scientific domains to which it can be applied. Visualization software design and engineering both study and solve what are essentially computer science problems. Much of visualization algorithm conception and design shares space with applied mathematics. Application of visualization concepts (and software) to specific scientific problems to produce insightful and useful images overlaps with cognitive psychology, art, and often the scientific domain itself.

Figure 1


Figure 1. Visualization offers the ability to “see the unseeable.” This image shows visualization of coherent flow structures in a large scale delta wing dataset: Volume rendering of regions of high forward (red) and backward (blue) Finite Time Lyapunov Exponent. Coherent structures appear as surfaces corresponding to the major vortices developing over the wing along the leading edge.2 Occlusion is a limitation that can be addressed with cropping or clipping. (Image courtesy of X. Tricoche, University of Utah and C. Garth, University of California – Davis).

In the present day, the U.S. Department of Energy has a significant investment in many science programs. Some of these programs, carried out under the Scientific Discovery through Advanced Computing (SciDAC) program,3 aim to study, via simulation, scientific phenomena on the world’s largest computer systems. These new scientific simulations, which are being carried out on fractional-petascale sized machines today, generate vast amounts of output data. Managing and gaining insight from such data is widely accepted as one of the bottlenecks in contemporary science.4 As a result, DOE’s SciDAC program includes efforts aimed at addressing data management and knowledge discovery to complement the computational science efforts.

The focus of this article is on how one group of researchers – the DOE SciDAC Visualization and Analytics Center for Enabling Technologies (VACET) – is tackling the daunting task of enabling knowledge discovery through visualization and analytics on some of the world’s largest and most complex datasets and on some of the world's largest computational platforms. As a Center for Enabling Technology, VACET’s mission is the creation of usable, production-quality visualization and knowledge discovery software infrastructure that runs on large, parallel computer systems at DOE's Open Computing facilities, and that provides solutions to challenging visual data exploration and knowledge discovery needs of modern science, particularly the DOE science community.

Pages: 1 2 3 4 5 6 7 8

Kwan-Liu Ma, University of California, Davis

1
Introduction

Supercomputers give scientists the power to model highly complex and detailed physical phenomena and chemical processes, leading to many advances in science and engineering. With the current growth rates of supercomputing speed and capacity, scientists are anticipated to study many problems of unprecedented complexity and fidelity and attempt to study many new problems for the first time. The size and complexity of the data produced by such ultra-scale simulations, however, present tremendous challenges to the subsequent data visualization and analysis tasks, creating a growing gap between scientists’ ability to simulate complex physics at high resolution and their ability to extract knowledge from the resulting massive data sets. The Institute for Ultrascale Visualization,12 funded by the U.S. Department of Energy’s SciDAC program, 3 aims to close this gap by developing advanced visualization technologies that enable knowledge discovery at the peta and exa-scale. This article reveals three such enabling technologies that are critical to the future success of scientific supercomputing and discovery.

Parallel Visualization

Parallel visualization can be a useful path to understanding data at the ultra scale, but is not without its own challenges, especially across our diverse scientific user community. The Ultravis Institute has brought together leading experts from visualization, high-performance computing, and science application areas to make parallel visualization technology a commodity for SciDAC scientists and the broader community. One distinct effort is the development of scalable parallel visualization methods for understanding vector field data. Vector field visualization is more difficult to do than scalar field visualization because it generally requires more computing for conveying the directional information and more storage space to store the vector field.

So far, more researchers have worked on the visualization of scalar field data than vector field data, regardless of the fact that vector fields in the same data sets are equally critical to the understanding of the modeled phenomena. 3D vector field visualization particularly requires more attention from the research community because most of the effective 2D vector field visualization methods incur visual clutter when directly applied to depicting 3D vector data. For large data sets, a scalable parallel visualization solution for depicting a vector field is needed even more because the expanded space requirement and additional calculations needed to ensure temporal coherence for visualizing time-varying vector data. Furthermore, it is challenging to simultaneously visualize both scalar and vector fields due to the added complexity of rendering calculations and combined computing requirements. As a result, previous works in vector field visualization primarily focused on 2D, steady flow fields, the associated seed/glyph placement problem, or the topological aspect of the vector fields.

Particle tracing is fundamental to portraying the structure and direction of a vector flow field. When an appropriate set of seed points are used, we can construct paths and surfaces from the traced particles to effectively characterize the flow field. Visualizing a large time-varying vector field on a parallel computer using particle tracing presents some unique challenges. Even though the tracing of each individual particle is independent of other particles, a particle may drift to anywhere in the spatial domain over time, demanding interprocessor communication. Furthermore, as particles move around, the number of particles each processor must handle varies, leading to uneven workloads. We have developed a scalable, parallel particle tracing algorithm allowing us to visualize large time-varying 3D vector fields at the desired resolution and precision.4 Figure 1 shows visualization of a velocity field superimposed with volume rendering of a scalar field from a supernova simulation.

Figure 1


Figure 1. Simultaneous visualization of velocity and angular momentum fields obtained from a supernova simulation.

We take a high-dimensional approach by treating time as the fourth dimension, rather than considering space and time as separate entities. In this way, a 4D volume is used to represent a time-varying 3D vector field. This unified representation enables us to make a time-accurate depiction of the flow field. More importantly, it allows us to construct pathlines by simply tracing streamlines in the 4D space. To support adaptive visualization of the data, we cluster the 4D space in a hierarchical manner. The resulting hierarchy can be used to allow visualization of the data at different levels of abstraction and interactivity. This hierarchy also facilitates data partitioning for efficient parallel pathline construction. We have achieved excellent parallel efficiency using up to 256 processors for the visualization of large flow fields.4 This new capability enables scientists to see their vector field data in unprecedented detail, at varying abstraction levels, and with higher interactivity, as shown in Figure 2.

Figure 2aFigure 2b


Figure 2. Pathline visualization of velocity field from a supernova simulation and the corresponding vector field partitioning.

Pages: 1 2 3 4

Jennifer M. Schopf, University of Chicago and Argonne National Laboratory
Ann Chervenak, University of Southern California
Ian Foster, University of Chicago and Argonne National Laboratory
Dan Fraser, University of Chicago and Argonne National Laboratory
Dan Gunter, Lawrence Berkeley National Laboratory
Nick LeRoy, University of Wisconsin
Brian Tierney, Lawrence Berkeley National Laboratory

1
1. Petascale Science is an End-to-end Problem

Petascale science is an end-to-end endeavor, involving not only the creation of massive datasets at supercomputers or experimental facilities, but the subsequent analysis of that data by a user community that may be distributed across many laboratories and universities. The new Center for Enabling Distributed Petascale Science (CEDPS), supported by the US Department of Energy’s Scientific Discovery through Advanced Computing (SciDAC) program, is developing tools to support this end-to-end process. In this brief article, we summarize the goals of the project and its progress to date. Some material is adapted from a longer article that appeared in the 2007 SciDAC conference proceedings.1

At a recent workshop on computational science, the chair noted in his introductory remarks that if the speed of airplanes had increased by the same factor as computers over the last 50 years, namely five orders of magnitude, then we would be able to cross the US in less than a second. This analogy communicates with great effectiveness the remarkable impact of continued exponential growth in computational performance, which along with comparable improvements in solution methods is arguably the foundation for SciDAC.

However, a participant was heard to exclaim following these remarks: “yes—but it would still take two hours to get downtown!” The serious point that this speaker was making is that science is an end-to-end problem and that accelerating just one single aspect of the problem solving process can inevitably achieve only limited returns in terms of increased scientific productivity.

These concerns become particularly important as we enter the era of petascale science, by which we mean science involving numerical simulations performed on supercomputers capable of a petaflop/sec or higher performance, and/or experimental apparatus—such as the Large Hadron Collider,2 light sources and other user facilities,3 and ITER4 —capable of producing petabytes of data. Successful science using such devices demands not only that we be able to construct and operate the simulation or experiment, but also that a distributed community of participants be able to access, analyze, and ultimately make sense of the resulting massive datasets. In the absence of appropriate solutions to the end-to-end problem, the utility of these unique apparatus can be severely compromised.

The following example illustrates issues that can arise in such contexts. A team at the University of Chicago recently used the FLASH3 code to perform the world’s largest compressible, homogeneous isotropic turbulence simulation.5 Using 11 million CPU-hours on the LLNL BG/L computer over a period of a week, they produced a total of 154 terabytes of data, contained in 75 million files that were subsequently archived. Subsequently, they used GridFTP to move 23 terabytes of this data to computers at the University of Chicago; using four parallel streams, this took some three weeks at around 20 megabyte/sec. Next, they spent considerable time using local resources to tag the data, analyze it, and visualize it, augmenting the metadata as well. In a final step, they are making this unique dataset available for use by the community of turbulence researchers by providing analysis services so that other researchers can securely download portions of the data for their own use. In each of these steps, they were ultimately successful—but they would be the first to argue that the effort required to achieve their end-to-end goals of scientific publications and publicly available datasets was excessive.

As this example illustrates, a complete solution to the end-to-end problem may require not only methods for parallel petascale simulation and high-performance parallel I/O (both handled by the FLASH3 code and associated parallel libraries), but also efficient and reliable methods for:

  • high-speed reliable data placement, to transfer data from its site of creation to other locations for subsequent analysis;
  • terascale or faster local data analysis, to enable exploration of data that has been fetched locally;
  • high-performance visualization, to enable perusal of selected subsets and features of large datasets data prior to download;
  • troubleshooting the complex end-to-end system, which due to its myriad hardware and software components can fail in a wide range of often hard-to-diagnose ways;
  • building and operating scalable services,6 so that many users can request analyses of data without having to download large subsets [this aspect of the project is not addressed in this article];
  • securing the end-to-end system, in a manner that prevents (and/or can detect) intrusions and other attacks, without preventing the high-performance data movement and collaborative access that is essential to petascale science; and
  • orchestrating these various activities, so that they can be performed routinely and repeatedly.

Each of these requirements can be a significant challenge when working at the petascale level. Thus, a new SciDAC Center for Enabling Technology, the Center for Enabling Distributed Petascale Science (CEDPS) was recently established to support the work of any SciDAC program that involves the creation, movement, and/or analysis of large amounts of data, with a focus on data placement, scalable services, and troubleshooting.

Pages: 1 2 3 4 5 6

Arie Shoshani, Lawrence Berkeley National Laboratory
Ilkay Altintas, San Diego Supercomputer Center
Alok Choudhary, Northwestern University
Terence Critchlow, Pacific Northwest National Laboratory
Chandrika Kamath, Lawrence Livermore National Laboratory
Bertram Ludäscher, University of California, Davis
Jarek Nieplocha, Pacific Northwest National Laboratory
Steve Parker, University of Utah
Rob Ross, Argonne National Laboratory
Nagiza Samatova, Oak Ridge National Laboratory
Mladen Vouk, North Carolina State University

1
Introduction

Terascale computing and large scientific experiments produce enormous quantities of data that require effective and efficient management. The task of managing scientific data is so overwhelming that scientists spend much of their time managing the data by developing special purpose solutions, rather than using their time effectively for scientific investigation and discovery. Effectively generating, managing, and analyzing this information requires a comprehensive, end-to-end approach to data management that encompasses all of the stages, from the initial data acquisition to the final analysis of the data. Fortunately, the data management problems encountered by most scientific domains are common enough to be addressed through shared technology solutions. Based on community input, we have identified three significant requirements. First, more efficient access to storage systems is needed. In particular, parallel file system improvements are needed to read and write large volumes of data without slowing a simulation, analysis, or visualization engine. These processes are complicated by the fact that scientific data are structured differently for specific application domains, and are stored in specialized file formats. Second, scientists require technologies to facilitate better understanding of their data, in particular the ability to effectively perform complex data analysis and searches over large data sets. Specialized feature discovery and statistical analysis techniques are needed before the data can be understood or visualized. To facilitate efficient access, it is necessary to keep track of the location of the datasets, effectively manage storage resources, and efficiently select subsets of the data. Finally, generating the data, collecting and storing the results, data post-processing, and analysis of results is a tedious, fragmented process. Tools for automation of this process in a robust, tractable, and recoverable fashion are required to enhance scientific exploration.

The Scientific Data Management (SDM) Center,1 funded under the DOE SciDAC program, focuses on the application of known and emerging data management technologies to scientific applications. The Center’s goals are to integrate and deploy software-based solutions to the efficient and effective management of large volumes of data generated by scientific applications. Our purpose is not only to achieve efficient storage and access to the data using specialized indexing, compression, and parallel storage and access technology, but also to enhance the effective use of the scientist’s time by eliminating unproductive simulations, by providing specialized data-mining techniques, by streamlining time-consuming tasks, and by automating the scientist’s workflows. Our approach is to provide an integrated scientific data management framework where components can be chosen by the scientists and applied to their specific domains. By overcoming the data management bottlenecks and unnecessary information-technology overhead through the use of this integrated framework, scientists are freed to concentrate on their science and achieve new scientific insights.

Pages: 1 2 3 4 5 6

Dean N. Williams, Lawrence Livermore National Laboratory
David E. Bernholdt, Oak Ridge National Laboratory
Ian T. Foster, Argonne National Laboratory
Don E. Middleton, National Center for Atmospheric Research

1
1. Introduction

Climate research is inherently a multidisciplinary endeavor. As researchers strive to understand the complexity of our climate system, they form multi-institutional and multinational teams to tackle “Grand Challenge” problems. These multidisciplinary, virtual organizations need a common software infrastructure to access the many large global climate model datasets and tools. It is critical that this infrastructure provide equal access to climate data, supercomputers, simulations, visualization software, whiteboard, and other resources. To this end, we established the Earth System Grid (ESG) Center for Enabling Technologies (ESG-CET),1 a collaboration of seven U.S. research laboratories (Argonne, LANL, LBNL, LLNL, NCAR, NOAA/PMEL, and ORNL) and a university (USC/ISI) working together to identify and implement key computational and informational technologies for advancing climate change science. Sponsored by the Department of Energy (DOE) Scientific Discovery through Advanced Computing (SciDAC)-22 program, through the Offices of Advanced Scientific Computing Research (OASCR)3 and the Offices of Biological and Environmental Research (OBER),4 ESG-CET utilizes and develops computational resources, software, data management, and collaboration technologies to support observational and modeling data archives.

Work on ESG began with the “Prototyping an Earth System Grid” (ESG I) project, initially funded under the DOE Next Generation Internet (NGI) program, with follow-on support from OBER and DOE’s Mathematical, Information, and Computational Sciences (MICS) office. In this prototyping project, we developed Data Grid technologies for managing the movement and replication of large datasets, and applied these technologies in a practical setting (an ESG-enabled data browser based on current climate data analysis tools), achieving cross-country transfer rates of more than 500 Mb/s. Having demonstrated the potential for remotely accessing and analyzing climate data located at sites across the U.S., we won the “Hottest Infrastructure” award in the Network Challenge event at the SC’2000 conference.

While the ESG I prototype provided a proof of concept (“Turning Climate Datasets into Community Resources”), the SciDAC Earth System Grid (ESG) II project5 6 made this a reality. Our efforts in that project targeted the development of metadata technologies7 (standard schema, XML metadata extraction based on netCDF, and a Metadata Catalog Service), security technologies8 (Web-based user registration and authentication, and community authorization), data transport technologies9 10 (GridFTP-enabled OPeNDAP-G for high-performance access, robust multiple file transport and integration with mass storage systems, and support for dataset aggregation and subsetting), and web portal technologies to provide interactive access to climate data holdings. At this point, the technology was in place and assembled, and ESG II was poised to make a substantial impact on the climate modeling community.

In 2004, the National Center for Atmospheric Research (NCAR), a premier climate science laboratory and lead institution for the Community Climate System Model (CCSM) modeling collaboration, began its first publication of climate model data into the ESG system, drawing on simulation data archived at LANL, LBNL, NCAR, and ORNL. Late that same year, the Program for Climate Model Diagnosis and Intercomparison (PCMDI), an internationally recognized climate data center at LLNL, launched a production service providing access to climate model data germane to the Intergovernmental Panel on Climate Change (IPCC) 4th Assessment Report (AR4).11 (Because of international data requirements, restrictions, and timelines, the NCAR and PCMDI ESG data holdings were separated.) ESG has since become a world-renowned leader in developing technologies that provide scientists with virtual access to distributed data and resources.

In its first full year of production (late 2005), the two ESG sites provided access to a total of 220 TB of data, served over 3,000 registered users, and delivered over 100 TB of data to users worldwide. Analysis of just one component of ESG data holdings, those relating to the Coupled Model Intercomparison Project phase 3 (CMIP3), resulted in the publication of over 100 peer-reviewed scientific papers.

In 2006, we launched the current phase of the ESG effort, the ESG Center for Enabling Technologies (ESG-CET). The primary goal of this stage of the project is to broaden and generalize the ESG system to support a more broadly distributed, more international, and more diverse collection of archive sites and types of data. An additional goal is to extend the services provided by ESG beyond access to raw data by developing “server-side analysis” capabilities that will allow users to request the output from commonly used analysis and intercomparison procedures. We view such capabilities as essential if we are to enable large communities to make use of petascale data. However, their realization poses significant resource management and security challenges.

Pages: 1 2 3 4 5

Reference this article
Williams, D. N., Bernholdt, D. E., Foster, I. T., Middleton, D. E. "The Earth System Grid Center for Enabling Technologies: Enabling Community Access to Petascale Climate Datasets ," CTWatch Quarterly, Volume 3, Number 4, November 2007. http://www.ctwatch.org/quarterly/articles/2007/11/the-earth-system-grid-center-for-enabling-technologies-enabling-community-access-to-petascale-climate-datasets/

Any opinions expressed on this site belong to their respective authors and are not necessarily shared by the sponsoring institutions or the National Science Foundation (NSF).

Any trademarks or trade names, registered or otherwise, that appear on this site are the property of their respective owners and, unless noted, do not represent endorsement by the editors, publishers, sponsoring institutions, the National Science Foundation, or any other member of the CTWatch team.

No guarantee is granted by CTWatch that information appearing in articles published by the Quarterly or appearing in the Blog is complete or accurate. Information on this site is not intended for commercial purposes.