In discussions with application scientists, it is clear that users want to focus on their science and not be burdened with optimizing their code’s performance. Thus, the ideal performance tool analyzes and optimizes performance without human intervention, a long-term vision that we term automatic performance tuning. This vision encompasses tools that analyze a scientific application, both as source code and during execution, generate a space of tuning options, and search for a near-optimal performance solution. There are numerous daunting challenges to realizing the vision, including enhancement of automatic code manipulation tools, automatic run-time parameter selection, automatic communication optimization, and intelligent heuristics to control the combinatorial explosion of tuning possibilities. On the other hand, we are encouraged by recent successful results such as ATLAS, which has automatically tuned components of the LAPACK linear algebra library.13 We are also studying techniques used in the highly successful FFTW library14 and several other related projects.15 16 17 The PERI strategy for automatic performance tuning is presented in greater detail in this section of this article.
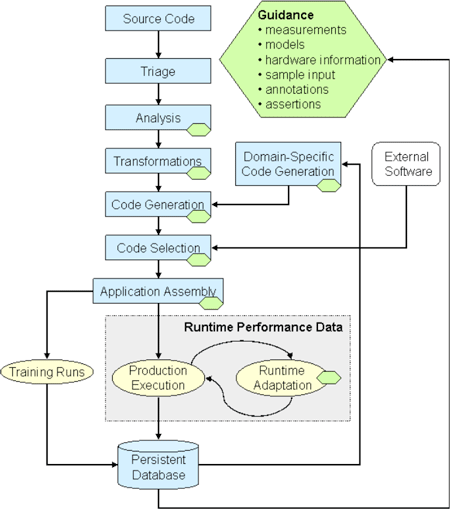
Figure 1 illustrates the automated performance tuning process and integration we are pursuing in PERI. We are attempting to integrate performance measurement and modeling techniques with code transformations to create an automated tuning process for optimizing complex codes on large-scale architectures. The result will be an integrated compile-time and run-time optimization methodology that can reduce dependence on human experts and automate key aspects of code optimization. The color and shape code in Figure 1 indicates the processes associated with the automation of empirical tuning on either libraries or whole applications. Blue rectangles indicate specific tools or parts of tools to support automated empirical tuning. Yellow ovals indicate activities that are part of a code that is using automatic tuning at run-time. Green hexagons indicate information may be supplied to guide the optimization selection during empirical tuning. The large green hexagon lists the type of information that may be used.

As shown in Figure 1, the main input to the automatic tuning process is the application source code. In addition, there may also be external code (e.g., libraries), ancillary information such as performance models or annotations, sample input data, and historical data from previous executions and analyses. With these inputs, we anticipate that the automatic tuning process involves the following steps:
- Triage. This step involves performance measurement, analysis and modeling to determine whether an application has opportunities for optimization.
- Semantic analysis. This step involves analysis of program semantics to support safe trans-formation of the source code, including traditional compiler analyses to determine data and control dependencies. Here we can also exploit semantic information provided by the user.
- Transformation. Transformations include traditional optimizations such as loop optimizations and in-lining, as well as more aggressive data structure reorganizations and domain-specific optimizations. Tiling transformations may be parameterized to allow for input size and machine characteristic tuning. Unlike traditional compiler transformations, we allow user input.
- Code generation. The code generation phase produces a set of possible implementations to be considered. Code generation may either come from general transformations to source code in an application or from a domain-specific tool that produces a set of implementations for a given computation, as is the case with the ATLAS BLAS generator.
- Offline search. This phase evaluates the generated code to select the “best” version. Offline search entails running the generated code and searching for the best-performing implementation. The search process may be constrained by guidance from a performance model or user input. By viewing these constraints as guidance, we allow the extremes of pure search-based, model-based, or user-directed, as well as arbitrary combinations.
- Application assembly. At this point, the components of optimized code are integrated to produce an executable code, including possible instrumentation and support for dynamic tuning.
- Training runs. Training runs involve a separate execution step designed mainly to produce performance data for feedback into the optimization process. This step may be used prior to a large run to have the code well-tuned for a particular input set.
- Online adaptation. Finally, optimizations may occur during production runs, especially for problems or machines whose optimal configuration changes during the execution.
Automatic tuning of a particular application need not involve all of these steps. Furthermore, there will likely not be a single automatic tuning tool, but rather a suite of interacting tools that are themselves research projects.
A key part of the automatic tuning process is the maintenance of a persistent store of perform-ance information from both training and production runs. Of particular concern are changes in the behavior of production codes over time. Such changes can be symptomatic of changes in the hardware, of the versions and configuration of system software, of changes to the application, or of changes to problems being solved. Regardless of the source, such changes require analysis and remediation. The problem of maintaining persistent performance data is recognized across the HPC community. PERI therefore formed a Performance Database Working Group, which involves PERI researchers as well as colleagues at the University of Oregon, Portland State University, and Texas A&M University. The group has developed technology for storing performance data collected by a number of performance measurement and analysis tools, including TAU, PerfTrack, Prophesy, and SvPablo. The PERI Database system provides web interfaces that link to the performance data and analysis tools in each tool's home database.


