

Distributed data management involves end-to-end systems comprising of many different hardware and software components in different physical locations and administrative domains. Failures can occur and they can be hard to diagnose. Experience with current DOE distributed system deployments has shown that understanding behavior is a fundamental requirement, not just a desirable enhancement. Middleware may also mask performance faults, when applications produce correct results but experience degradation in performance.
In order to better understand failures and to increase the reliability of the end-to end system, we have developed tools to allow easer access to logs and additional log analysis software that performs anomaly detection. In addition, we have also deployed a higher-level monitoring tool that observes services and generates notifications when errors occur.
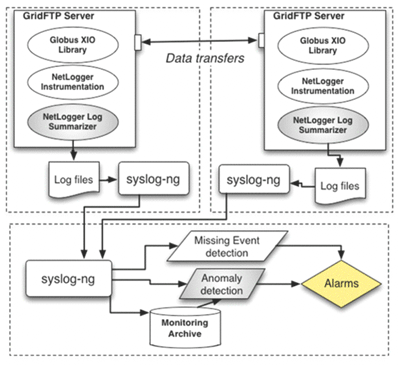
Figure 3 shows the CEDPS log management service based on the syslog-ng system.16 We mine software and service logs (such as those from GridFTP, MOPS, or other tools), which are filtered and forwarded to a common location. That combined set of data can then be analyzed. We have used NetLogger17 to access performance data and discover faulty event chains where expected behavior does not occur. We have also developed prototypes of anomaly detection tools that can detect a missing event in an event stream and also identify unexpected performance variations that indicate an underlying problem that may not cause an out right failure.18 This system is currently in the process of being deployed on the Open Science Grid (OSG).19
Both of these tools have been aided by effort spent on improving the quality and consistency of available performance information. Specifically, we have codified a set of logging “Best Practices,” 20 and are modifying the Globus Toolkit21 to follow these practices. In defining these guidelines, we have worked with the European EGEE project to achieve compatibility with their security logging guidelines,22 an important requirement for LHC computing.
To compliment our log services and to assist further with our scenario elements 5 and 6 (failure reduction and detection), we have also developed a Trigger service18 that runs small probes and notifies system administrators and end users when certain conditions are met. These can include a service failure or failure to respond to a ping, or a warning condition, such as a nearly full disk, overly long queue, or high load condition on a resource. The Trigger service has been used by ESG for over three years for system failure notifications and to help diagnose errors. We have re-architected this component to allow for additional trigger services, a separation of matching conditions and actions taken upon failure notification, and easier deployment through a Web interface.
These tools combine to give us additional support in the end-to-end data management environment.


