Over the past 20 years, many novel visualization techniques have been invented but few have been deployed in production systems and tools. Even though some of techniques are made available in a few open-source visualization tools, scientists seem to prefer the more rudimentary tools they have been using. There are several reasons for this. First, scientists are reluctant to switch to a new tool unless the tool can seamlessly fit in their existing computing and analysis environment. Second, although the new technique may produce highly desired visualizations, it will not be widely employed if it requires a tedious process and special hardware to operate. Third and most importantly, for scientists to adopt a new tool, the tool must be very easy and intuitive to use. The past effort in the visualization research community largely focused on improving the performance and quality of visualization calculations. Only over the last few years have the design and deployment of appropriate user interfaces for advanced visualization techniques began to receive more attention.56
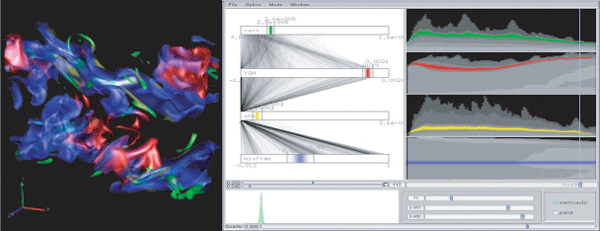
Interface design has played a major role in several of our visualization projects. One such visualization interface designed for exploring time-varying, multivariate volume data consists of three components, which abstract the complexity of exploring in different spaces of the data and visualization parameters.7 One important concept realized here is that the interface is also the visualization itself. As shown in Figure 3, the right-most panel displays the time histograms of the data. A time histogram shows how the distribution of data values changes over the whole time sequence and can thus help the user to identify time steps of interest and to specify time-varying features. The middle panel attempts to display the potential correlation between each pair of variables in parallel coordinates for a selected time step. By examining different pairs of variables, the user can often identify features of interest based on the correlations observed. The left-most panel displays the hardware accelerated volume rendering enhanced with the capability to render multiple variables into a single visualization in a user controllable fashion. Such simultaneous visualization of multiple scalar quantities allows users to more closely explore and validate their simulations from the parallel-coordinate space to the 3D physical space. These three components are tightly cross linked to facilitate tri-space data exploration, offering scientists new power to study their time-varying volume data.

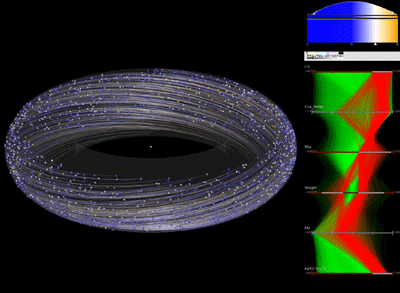
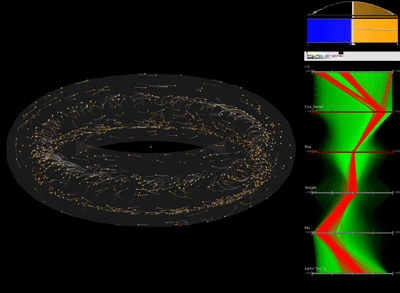
The other interface design effectively facilitates visualization of multidimensional particle data output from a gyrokinetic simulation.8 Depicting the complex phenomena associated with the particle data presents a challenge due to the large quantity of particles, variables, and time steps. By utilizing two modes of interaction–physical space and variable space–our system allows scientists to explore collections of densely packed particles and discover interesting features within the data. While single variables can be easily explored through the use of a one dimensional transfer function, we again turn to the information visualization approach of parallel coordinates for interactively selecting particles in multivariate space. In this manner, particles with deeper connections can be separated from the rest of the data and then rendered using sphere glyphs and pathlines, as shown in Figure 4. With this system, scientists at Princeton Plasma Physics Laboratory are able to more easily identify features of interest, such as the location and motion of particles that become trapped in turbulent plasma flow. The combination of scientific and information visualization techniques extend our ability to analyze complex collections of particles.


In addition, we have been studying how to incorporate machine learning into the process of visualization, leading to an intelligent interface for data visualization. Intelligent interfaces are anticipated to replace the current clutter of hardware-specific and algorithm-specific controls with a simple and intuitive interface supported by an invisible layer of complex intelligent algorithms.6 Only high-level, goal-oriented decisions need to be made by the user, making cutting-edge visualization technology directly accessible to a wide range of application scientists. To make intelligent interfaces widely employed, we need to evaluate the effectiveness of the resulting interface designs using a variety of applications. These studies will pave the way to the creation of next-generation visualization technology. We believe the next generation visualization technology will be built upon further exploitation of human perception to simplify visualization, advanced hardware features to accelerate visualization calculations, and machine learning to reduce the complexity, size, and high-dimensionality of data.


