PAPI 7.1.0.0
Loading...
Searching...
No Matches
perf_event.c File Reference
Include dependency graph for perf_event.c:

Go to the source code of this file.

Macros

#define OBSOLETE_WORKAROUNDS   0
 
#define PERF_EVENTS_OPENED   0x01
 
#define PERF_EVENTS_RUNNING   0x02
 
#define HANDLE_STRING_ERROR   {fprintf(stderr,"%s:%i unexpected string function error.\n",__FILE__,__LINE__); exit(-1);}
 
#define PAPI_REFRESH_VALUE   1
 
#define READ_BUFFER_SIZE   (3 + (2 * PERF_EVENT_MAX_MPX_COUNTERS))
 

Functions

static int _pe_set_domain (hwd_control_state_t *ctl, int domain)
 
static int pe_vendor_fixups (papi_vector_t *vector)
 
static int bug_format_group (void)
 
static int fcntl_setown_fd (int fd)
 
static unsigned int get_read_format (unsigned int multiplex, unsigned int inherit, int format_group)
 
void check_exclude_guest (void)
 
static void perf_event_dump_attr (struct perf_event_attr *hw_event, pid_t pid, int cpu, int group_fd, unsigned long int flags)
 
static int map_perf_event_errors_to_papi (int perf_event_error)
 
static int check_permissions (unsigned long tid, unsigned int cpu_num, unsigned int domain, unsigned int granularity, unsigned int multiplex, unsigned int inherit)
 
static int check_scheduability (pe_context_t *ctx, pe_control_t *ctl, int idx)
 
static int configure_fd_for_sampling (pe_control_t *ctl, int evt_idx)
 
static int set_up_mmap (pe_control_t *ctl, int evt_idx)
 
static void arm64_request_user_access (struct perf_event_attr *hw_event)
 
static int open_pe_events (pe_context_t *ctx, pe_control_t *ctl)
 
static int close_event (pe_event_info_t *event)
 
static int close_pe_events (pe_context_t *ctx, pe_control_t *ctl)
 
static int _pe_shutdown_thread (hwd_context_t *ctx)
 
static int _pe_init_thread (hwd_context_t *hwd_ctx)
 
static int _pe_reset (hwd_context_t *ctx, hwd_control_state_t *ctl)
 
static int _pe_write (hwd_context_t *ctx, hwd_control_state_t *ctl, long long *from)
 
static int _pe_rdpmc_read (hwd_context_t *ctx, hwd_control_state_t *ctl, long long **events, int flags)
 
static int _pe_read_multiplexed (pe_control_t *pe_ctl)
 
static int _pe_read_nogroup (pe_control_t *pe_ctl)
 
static int _pe_read (hwd_context_t *ctx, hwd_control_state_t *ctl, long long **events, int flags)
 
static int _pe_start (hwd_context_t *ctx, hwd_control_state_t *ctl)
 
static int _pe_stop (hwd_context_t *ctx, hwd_control_state_t *ctl)
 
static int _pe_update_control_state (hwd_control_state_t *ctl, NativeInfo_t *native, int count, hwd_context_t *ctx)
 
static int _pe_ctl (hwd_context_t *ctx, int code, _papi_int_option_t *option)
 
static int _pe_init_control_state (hwd_control_state_t *ctl)
 
static int _pe_ntv_enum_events (unsigned int *PapiEventCode, int modifier)
 
static int _pe_ntv_name_to_code (const char *name, unsigned int *event_code)
 
static int _pe_ntv_code_to_name (unsigned int EventCode, char *ntv_name, int len)
 
static int _pe_ntv_code_to_descr (unsigned int EventCode, char *ntv_descr, int len)
 
static int _pe_ntv_code_to_info (unsigned int EventCode, PAPI_event_info_t *info)
 
static int find_profile_index (EventSetInfo_t *ESI, int evt_idx, int *flags, unsigned int *native_index, int *profile_index)
 
static int process_smpl_buf (int evt_idx, ThreadInfo_t **thr, int cidx)
 
static void _pe_dispatch_timer (int n, hwd_siginfo_t *info, void *uc)
 
static int _pe_stop_profiling (ThreadInfo_t *thread, EventSetInfo_t *ESI)
 
static int _pe_set_overflow (EventSetInfo_t *ESI, int EventIndex, int threshold)
 
static int _pe_set_profile (EventSetInfo_t *ESI, int EventIndex, int threshold)
 
static int _pe_shutdown_component (void)
 
static int _pe_detect_rdpmc (void)
 
static int _pe_handle_paranoid (papi_vector_t *component)
 
static int _pe_init_component (int cidx)
 

Variables

papi_vector_t _perf_event_vector
 
struct native_event_table_t perf_native_event_table
 
static int our_cidx
 
static int exclude_guest_unsupported
 

Macro Definition Documentation

◆ HANDLE_STRING_ERROR

#define HANDLE_STRING_ERROR   {fprintf(stderr,"%s:%i unexpected string function error.\n",__FILE__,__LINE__); exit(-1);}

Definition at line 70 of file perf_event.c.

◆ OBSOLETE_WORKAROUNDS

#define OBSOLETE_WORKAROUNDS   0

Definition at line 61 of file perf_event.c.

◆ PAPI_REFRESH_VALUE

#define PAPI_REFRESH_VALUE   1

Definition at line 88 of file perf_event.c.

◆ PERF_EVENTS_OPENED

#define PERF_EVENTS_OPENED   0x01

Definition at line 64 of file perf_event.c.

◆ PERF_EVENTS_RUNNING

#define PERF_EVENTS_RUNNING   0x02

Definition at line 65 of file perf_event.c.

◆ READ_BUFFER_SIZE

#define READ_BUFFER_SIZE   (3 + (2 * PERF_EVENT_MAX_MPX_COUNTERS))

Definition at line 500 of file perf_event.c.

Function Documentation
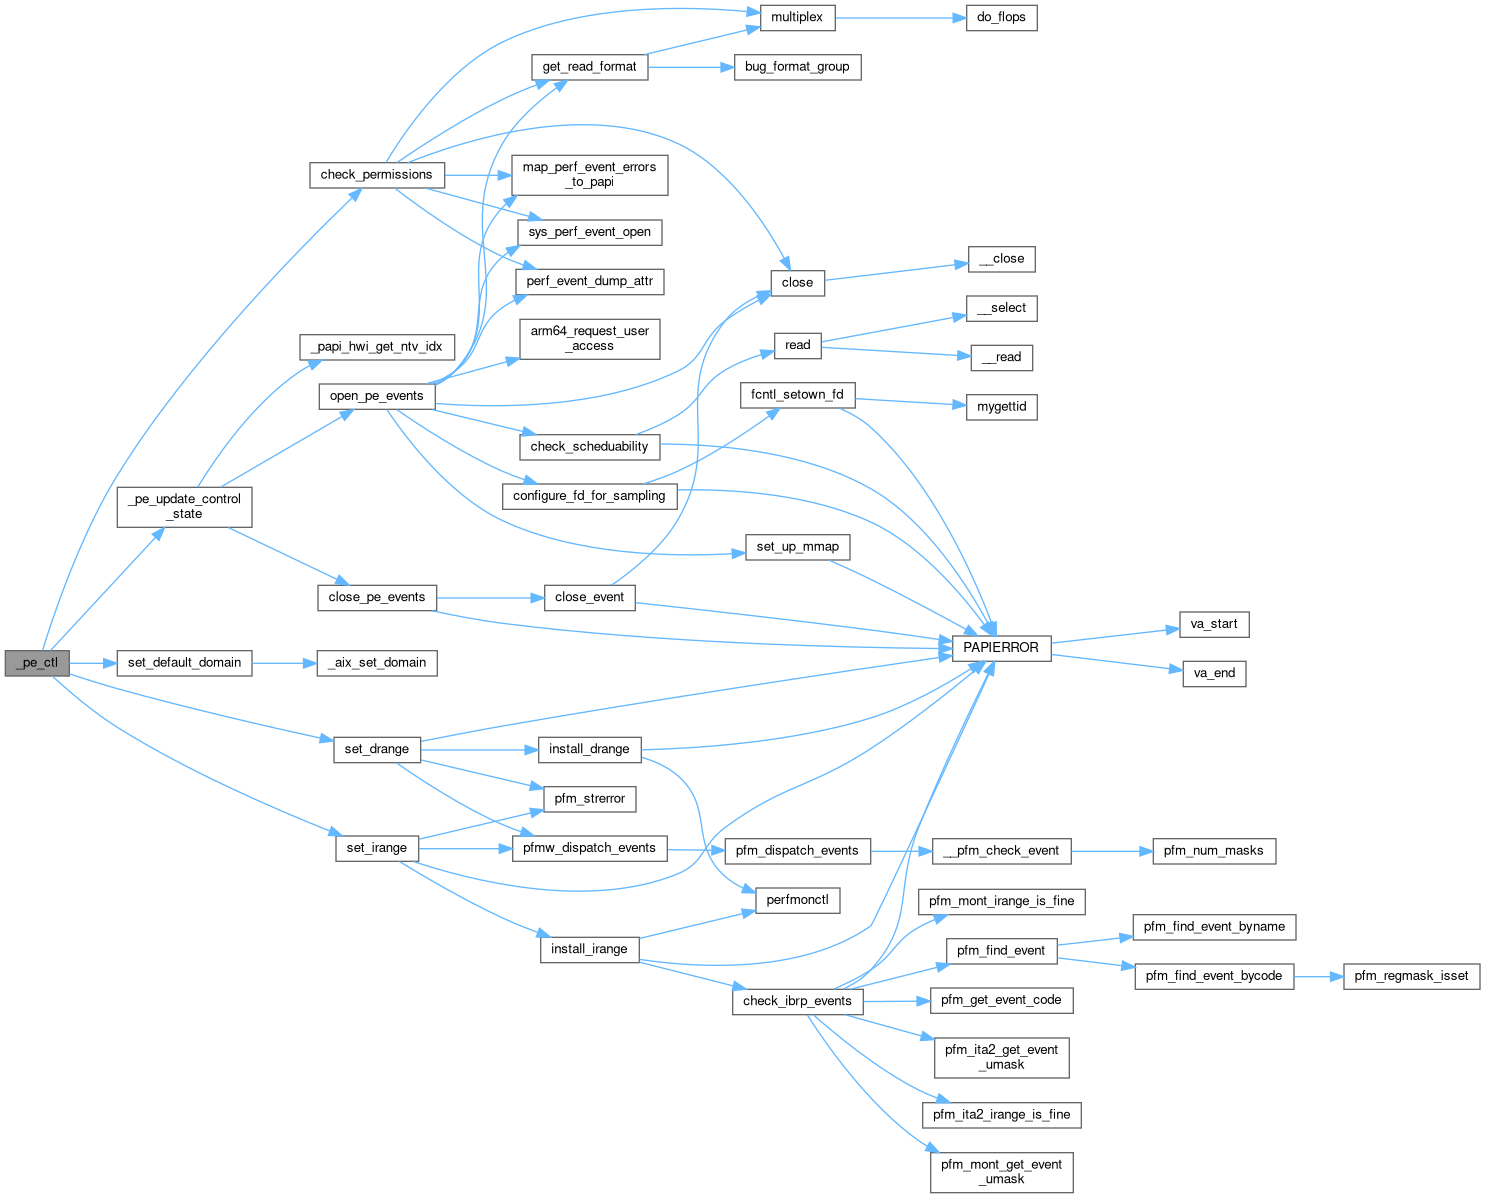
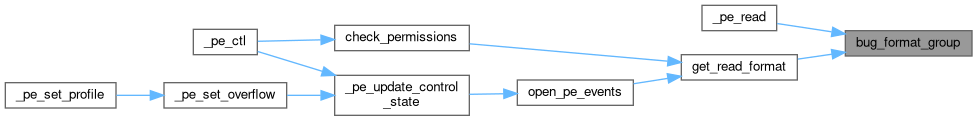
◆ _pe_ctl()

static int _pe_ctl ( hwd_context_t ctx,
int  code,
_papi_int_option_t option 
)
static

Definition at line 1670 of file perf_event.c.

1671{
1672 int ret;
1673 pe_context_t *pe_ctx = ( pe_context_t *) ctx;
1674 pe_control_t *pe_ctl = NULL;
1675
1676 switch ( code ) {
1677 case PAPI_MULTIPLEX:
1678 pe_ctl = ( pe_control_t * ) ( option->multiplex.ESI->ctl_state );
1679 ret = check_permissions( pe_ctl->tid, pe_ctl->cpu, pe_ctl->domain,
1680 pe_ctl->granularity,
1681 1, pe_ctl->inherit );
1682 if (ret != PAPI_OK) {
1683 return ret;
1684 }
1685
1686 /* looks like we are allowed, so set multiplexed attribute */
1687 pe_ctl->multiplexed = 1;
1688 ret = _pe_update_control_state( pe_ctl, NULL,
1689 pe_ctl->num_events, pe_ctx );
1690 if (ret != PAPI_OK) {
1691 pe_ctl->multiplexed = 0;
1692 }
1693 return ret;
1694
1695 case PAPI_ATTACH:
1696 pe_ctl = ( pe_control_t * ) ( option->attach.ESI->ctl_state );
1697 ret = check_permissions( option->attach.tid, pe_ctl->cpu,
1698 pe_ctl->domain, pe_ctl->granularity,
1699 pe_ctl->multiplexed,
1700 pe_ctl->inherit );
1701 if (ret != PAPI_OK) {
1702 return ret;
1703 }
1704
1705 pe_ctl->attached = 1;
1706 pe_ctl->tid = option->attach.tid;
1707
1708 /* If events have been already been added, something may */
1709 /* have been done to the kernel, so update */
1710 ret =_pe_update_control_state( pe_ctl, NULL,
1711 pe_ctl->num_events, pe_ctx);
1712
1713 return ret;
1714
1715 case PAPI_DETACH:
1716 pe_ctl = ( pe_control_t *) ( option->attach.ESI->ctl_state );
1717
1718 pe_ctl->attached = 0;
1719 pe_ctl->tid = 0;
1720
1721 return PAPI_OK;
1722
1723 case PAPI_CPU_ATTACH:
1724 pe_ctl = ( pe_control_t *) ( option->cpu.ESI->ctl_state );
1725 ret = check_permissions( pe_ctl->tid, option->cpu.cpu_num,
1726 pe_ctl->domain, pe_ctl->granularity,
1727 pe_ctl->multiplexed,
1728 pe_ctl->inherit );
1729 if (ret != PAPI_OK) {
1730 return ret;
1731 }
1732 /* looks like we are allowed so set cpu number */
1733
1734 pe_ctl->cpu = option->cpu.cpu_num;
1735
1736 return PAPI_OK;
1737
1738 case PAPI_DOMAIN:
1739 pe_ctl = ( pe_control_t *) ( option->domain.ESI->ctl_state );
1740 ret = check_permissions( pe_ctl->tid, pe_ctl->cpu,
1741 option->domain.domain,
1742 pe_ctl->granularity,
1743 pe_ctl->multiplexed,
1744 pe_ctl->inherit );
1745 if (ret != PAPI_OK) {
1746 return ret;
1747 }
1748 /* looks like we are allowed, so set event set level counting domains */
1749 pe_ctl->domain = option->domain.domain;
1750 return PAPI_OK;
1751
1752 case PAPI_GRANUL:
1753 pe_ctl = (pe_control_t *) ( option->granularity.ESI->ctl_state );
1754
1755 /* FIXME: we really don't support this yet */
1756
1757 switch ( option->granularity.granularity ) {
1758 case PAPI_GRN_PROCG:
1759 case PAPI_GRN_SYS_CPU:
1760 case PAPI_GRN_PROC:
1761 return PAPI_ECMP;
1762
1763 /* Currently we only support thread and CPU granularity */
1764 case PAPI_GRN_SYS:
1765 pe_ctl->granularity=PAPI_GRN_SYS;
1766 pe_ctl->cpu=_papi_getcpu();
1767 break;
1768
1769 case PAPI_GRN_THR:
1770 pe_ctl->granularity=PAPI_GRN_THR;
1771 break;
1772
1773
1774 default:
1775 return PAPI_EINVAL;
1776 }
1777 return PAPI_OK;
1778
1779 case PAPI_INHERIT:
1780 pe_ctl = (pe_control_t *) ( option->inherit.ESI->ctl_state );
1781 ret = check_permissions( pe_ctl->tid, pe_ctl->cpu, pe_ctl->domain,
1782 pe_ctl->granularity, pe_ctl->multiplexed,
1783 option->inherit.inherit );
1784 if (ret != PAPI_OK) {
1785 return ret;
1786 }
1787 /* looks like we are allowed, so set the requested inheritance */
1788 if (option->inherit.inherit) {
1789 /* children will inherit counters */
1790 pe_ctl->inherit = 1;
1791 } else {
1792 /* children won't inherit counters */
1793 pe_ctl->inherit = 0;
1794 }
1795 return PAPI_OK;
1796
1797 case PAPI_DATA_ADDRESS:
1798 return PAPI_ENOSUPP;
1799#if 0
1800 pe_ctl = (pe_control_t *) (option->address_range.ESI->ctl_state);
1801 ret = set_default_domain( pe_ctl, option->address_range.domain );
1802 if ( ret != PAPI_OK ) {
1803 return ret;
1804 }
1805 set_drange( pe_ctx, pe_ctl, option );
1806 return PAPI_OK;
1807#endif
1808 case PAPI_INSTR_ADDRESS:
1809 return PAPI_ENOSUPP;
1810#if 0
1811 pe_ctl = (pe_control_t *) (option->address_range.ESI->ctl_state);
1812 ret = set_default_domain( pe_ctl, option->address_range.domain );
1813 if ( ret != PAPI_OK ) {
1814 return ret;
1815 }
1816 set_irange( pe_ctx, pe_ctl, option );
1817 return PAPI_OK;
1818#endif
1819
1820 case PAPI_DEF_ITIMER:
1821 /* What should we be checking for here? */
1822 /* This seems like it should be OS-specific not component */
1823 /* specific. */
1824
1825 return PAPI_OK;
1826
1827 case PAPI_DEF_MPX_NS:
1828 /* Defining a given ns per set is not current supported */
1829 return PAPI_ENOSUPP;
1830
1831 case PAPI_DEF_ITIMER_NS:
1832 /* We don't support this... */
1833 return PAPI_OK;
1834
1835 default:
1836 return PAPI_ENOSUPP;
1837 }
1838}
static int set_default_domain(EventSetInfo_t *zero, int domain)
Definition: aix.c:510
#define PAPI_CPU_ATTACH
Definition: f90papi.h:19
#define PAPI_INSTR_ADDRESS
Definition: f90papi.h:209
#define PAPI_OK
Definition: f90papi.h:73
#define PAPI_GRN_PROCG
Definition: f90papi.h:202
#define PAPI_GRANUL
Definition: f90papi.h:179
#define PAPI_DETACH
Definition: f90papi.h:64
#define PAPI_ATTACH
Definition: f90papi.h:70
#define PAPI_EINVAL
Definition: f90papi.h:115
#define PAPI_ENOSUPP
Definition: f90papi.h:244
#define PAPI_DOMAIN
Definition: f90papi.h:159
#define PAPI_DEF_MPX_NS
Definition: f90papi.h:235
#define PAPI_INHERIT
Definition: f90papi.h:76
#define PAPI_ECMP
Definition: f90papi.h:214
#define PAPI_DATA_ADDRESS
Definition: f90papi.h:89
#define PAPI_GRN_SYS
Definition: f90papi.h:43
#define PAPI_GRN_SYS_CPU
Definition: f90papi.h:100
#define PAPI_GRN_PROC
Definition: f90papi.h:266
#define PAPI_MULTIPLEX
Definition: f90papi.h:223
#define PAPI_GRN_THR
Definition: f90papi.h:265
#define PAPI_DEF_ITIMER
Definition: papi.h:462
#define PAPI_DEF_ITIMER_NS
Definition: papi.h:463
#define _papi_getcpu()
Definition: linux-common.h:50
static int check_permissions(unsigned long tid, unsigned int cpu_num, unsigned int domain, unsigned int granularity, unsigned int multiplex, unsigned int inherit)
Definition: perf_event.c:439
static int _pe_update_control_state(hwd_control_state_t *ctl, NativeInfo_t *native, int count, hwd_context_t *ctx)
Definition: perf_event.c:1540
static int set_irange(hwd_context_t *ctx, hwd_control_state_t *current_state, _papi_int_option_t *option)
Definition: perfmon-ia64.c:919
static int set_drange(hwd_context_t *ctx, hwd_control_state_t *current_state, _papi_int_option_t *option)
Definition: perfmon-ia64.c:767
hwd_control_state_t * ctl_state
EventSetInfo_t * ESI
unsigned long tid
EventSetInfo_t * ESI
unsigned int cpu_num
EventSetInfo_t * ESI
unsigned int attached
unsigned int granularity
unsigned int multiplexed
unsigned int domain
unsigned int inherit
_papi_int_domain_t domain
_papi_int_multiplex_t multiplex
_papi_int_granularity_t granularity
_papi_int_attach_t attach
_papi_int_inherit_t inherit
_papi_int_cpu_t cpu
_papi_int_addr_range_t address_range
Here is the call graph for this function:

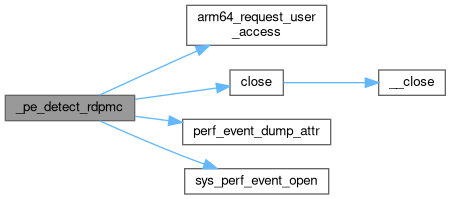
◆ _pe_detect_rdpmc()

static int _pe_detect_rdpmc ( void  )
static

Definition at line 2357 of file perf_event.c.

2357 {
2358
2359 struct perf_event_attr pe;
2360 int fd,rdpmc_exists=1;
2361 void *addr;
2362 struct perf_event_mmap_page *our_mmap;
2363 int page_size=getpagesize();
2364#if defined(__aarch64__)
2365 int retval;
2366#endif
2367
2368#if defined(__i386__) || defined (__x86_64__) || defined(__aarch64__)
2369#else
2370 /* We support rdpmc on x86 and arm64 for now */
2371 return 0;
2372#endif
2373
2374 /* There were various subtle bugs in rdpmc support before */
2375 /* the Linux 4.13 release. */
2376 if (_papi_os_info.os_version < LINUX_VERSION(4,13,0)) {
2377 return 0;
2378 }
2379
2380#if defined(__aarch64__)
2381 /* Detect if we can use PMU counter from User space for arm64 */
2382 retval = _pe_detect_arm64_access();
2383 if (retval == 0) {
2384 return 0;
2385 }
2386#endif
2387
2388 /* Create a fake instructions event so we can read a mmap page */
2389 memset(&pe,0,sizeof(struct perf_event_attr));
2390
2391 pe.type=PERF_TYPE_HARDWARE;
2392 pe.size=sizeof(struct perf_event_attr);
2393 pe.config=PERF_COUNT_HW_INSTRUCTIONS;
2394#if defined(__aarch64__)
2396#endif
2397 pe.exclude_kernel=1;
2398 pe.disabled=1;
2399
2400 perf_event_dump_attr(&pe,0,-1,-1,0);
2401 fd=sys_perf_event_open(&pe,0,-1,-1,0);
2402
2403 /* This hopefully won't happen? */
2404 /* Though there is a chance this is the first */
2405 /* attempt to open a perf_event */
2406 if (fd<0) {
2407 SUBDBG("FAILED perf_event_open trying to detect rdpmc support");
2408 return PAPI_ESYS;
2409 }
2410
2411 /* create the mmap page */
2412 addr=mmap(NULL, page_size, PROT_READ, MAP_SHARED,fd,0);
2413 if (addr == MAP_FAILED) {
2414 SUBDBG("FAILED mmap trying to detect rdpmc support");
2415 close(fd);
2416 return PAPI_ESYS;
2417 }
2418
2419 /* get the rdpmc info from the mmap page */
2420 our_mmap=(struct perf_event_mmap_page *)addr;
2421
2422 /* If cap_usr_rdpmc bit is set to 1, we have support! */
2423 if (our_mmap->cap_usr_rdpmc!=0) {
2424 rdpmc_exists=1;
2425 }
2426 else if ((!our_mmap->cap_bit0_is_deprecated) && (our_mmap->cap_bit0)) {
2427 /* 3.4 to 3.11 had somewhat broken rdpmc support */
2428 /* This convoluted test is the "official" way to detect this */
2429 /* To make things easier we don't support these kernels */
2430 rdpmc_exists=0;
2431 }
2432 else {
2433 rdpmc_exists=0;
2434 }
2435
2436 /* close the fake event */
2437 munmap(addr,page_size);
2438 close(fd);
2439
2440 return rdpmc_exists;
2441
2442}
PAPI_os_info_t _papi_os_info
Definition: aix.c:1210
int close(int fd)
Definition: appio.c:179
#define PAPI_ESYS
Definition: f90papi.h:136
#define LINUX_VERSION(a, b, c)
Definition: linux-common.h:4
#define SUBDBG(format, args...)
Definition: papi_debug.h:64
static void arm64_request_user_access(struct perf_event_attr *hw_event)
Definition: perf_event.c:686
static void perf_event_dump_attr(struct perf_event_attr *hw_event, pid_t pid, int cpu, int group_fd, unsigned long int flags)
Definition: perf_event.c:325
static long sys_perf_event_open(struct perf_event_attr *hw_event, pid_t pid, int cpu, int group_fd, unsigned long flags)
Definition: perf_helpers.h:21
static const pme_power_entry_t * pe
int retval
Definition: zero_fork.c:53
Here is the call graph for this function:
Here is the caller graph for this function:

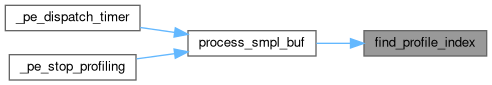
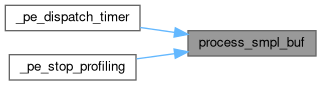
◆ _pe_dispatch_timer()

static void _pe_dispatch_timer ( int  n,
hwd_siginfo_t info,
void *  uc 
)
static

Definition at line 1969 of file perf_event.c.

1970{
1971 ( void ) n; /*unused */
1972 _papi_hwi_context_t hw_context;
1973 int found_evt_idx = -1, fd = info->si_fd;
1974 vptr_t address;
1976 int i;
1977 pe_control_t *ctl;
1979
1980 if ( thread == NULL ) {
1981 PAPIERROR( "thread == NULL in _papi_pe_dispatch_timer for fd %d!", fd );
1982 return;
1983 }
1984
1985 if ( thread->running_eventset[cidx] == NULL ) {
1986 PAPIERROR( "thread->running_eventset == NULL in "
1987 "_papi_pe_dispatch_timer for fd %d!",fd );
1988 return;
1989 }
1990
1991 if ( thread->running_eventset[cidx]->overflow.flags == 0 ) {
1992 PAPIERROR( "thread->running_eventset->overflow.flags == 0 in "
1993 "_papi_pe_dispatch_timer for fd %d!", fd );
1994 return;
1995 }
1996
1997 hw_context.si = info;
1998 hw_context.ucontext = ( hwd_ucontext_t * ) uc;
1999
2000 if ( thread->running_eventset[cidx]->overflow.flags &
2002 address = GET_OVERFLOW_ADDRESS( hw_context );
2003 _papi_hwi_dispatch_overflow_signal( ( void * ) &hw_context,
2004 address, NULL, 0,
2005 0, &thread, cidx );
2006 return;
2007 }
2008
2009 if ( thread->running_eventset[cidx]->overflow.flags !=
2011 PAPIERROR( "thread->running_eventset->overflow.flags "
2012 "is set to something other than "
2013 "PAPI_OVERFLOW_HARDWARE or "
2014 "PAPI_OVERFLOW_FORCE_SW for fd %d (%#x)",
2015 fd,
2016 thread->running_eventset[cidx]->overflow.flags);
2017 }
2018
2019 /* convoluted way to get ctl */
2020 ctl= thread->running_eventset[cidx]->ctl_state;
2021
2022 /* See if the fd is one that's part of the this thread's context */
2023 for( i=0; i < ctl->num_events; i++ ) {
2024 if ( fd == ctl->events[i].event_fd ) {
2025 found_evt_idx = i;
2026 break;
2027 }
2028 }
2029
2030 if ( found_evt_idx == -1 ) {
2031 PAPIERROR( "Unable to find fd %d among the open event fds "
2032 "_papi_hwi_dispatch_timer!", fd );
2033 return;
2034 }
2035
2036 if (ioctl( fd, PERF_EVENT_IOC_DISABLE, NULL ) == -1 ) {
2037 PAPIERROR("ioctl(PERF_EVENT_IOC_DISABLE) failed");
2038 }
2039
2040 if ( ( thread->running_eventset[cidx]->state & PAPI_PROFILING ) &&
2041 !( thread->running_eventset[cidx]->profile.flags &
2043 process_smpl_buf( found_evt_idx, &thread, cidx );
2044 }
2045 else {
2046 uint64_t ip;
2047 unsigned int head;
2048 pe_event_info_t *pe = &(ctl->events[found_evt_idx]);
2049 unsigned char *data = ((unsigned char*)pe->mmap_buf) + getpagesize( );
2050
2051 /*
2052 * Read up the most recent IP from the sample in the mmap buffer. To
2053 * do this, we make the assumption that all of the records in the
2054 * mmap buffer are the same size, and that they all contain the IP as
2055 * their only record element. This means that we can use the
2056 * data_head element from the user page and move backward one record
2057 * from that point and read the data. Since we don't actually need
2058 * to access the header of the record, we can just subtract 8 (size
2059 * of the IP) from data_head and read up that word from the mmap
2060 * buffer. After we subtract 8, we account for mmap buffer wrapping
2061 * by AND'ing this offset with the buffer mask.
2062 */
2063 head = mmap_read_head( pe );
2064
2065 if ( head == 0 ) {
2066 PAPIERROR( "Attempting to access memory "
2067 "which may be inaccessable" );
2068 return;
2069 }
2070 ip = *( uint64_t * ) ( data + ( ( head - 8 ) & pe->mask ) );
2071 /*
2072 * Update the tail to the current head pointer.
2073 *
2074 * Note: that if we were to read the record at the tail pointer,
2075 * rather than the one at the head (as you might otherwise think
2076 * would be natural), we could run into problems. Signals don't
2077 * stack well on Linux, particularly if not using RT signals, and if
2078 * they come in rapidly enough, we can lose some. Overtime, the head
2079 * could catch up to the tail and monitoring would be stopped, and
2080 * since no more signals are coming in, this problem will never be
2081 * resolved, resulting in a complete loss of overflow notification
2082 * from that point on. So the solution we use here will result in
2083 * only the most recent IP value being read every time there are two
2084 * or more samples in the buffer (for that one overflow signal). But
2085 * the handler will always bring up the tail, so the head should
2086 * never run into the tail.
2087 */
2088 mmap_write_tail( pe, head );
2089
2090 /*
2091 * The fourth parameter is supposed to be a vector of bits indicating
2092 * the overflowed hardware counters, but it's not really clear that
2093 * it's useful, because the actual hardware counters used are not
2094 * exposed to the PAPI user. For now, I'm just going to set the bit
2095 * that indicates which event register in the array overflowed. The
2096 * result is that the overflow vector will not be identical to the
2097 * perfmon implementation, and part of that is due to the fact that
2098 * which hardware register is actually being used is opaque at the
2099 * user level (the kernel event dispatcher hides that info).
2100 */
2101
2102 _papi_hwi_dispatch_overflow_signal( ( void * ) &hw_context,
2103 ( vptr_t ) ( unsigned long ) ip,
2104 NULL, ( 1 << found_evt_idx ), 0,
2105 &thread, cidx );
2106
2107 }
2108
2109 /* Restart the counters */
2110 if (ioctl( fd, PERF_EVENT_IOC_REFRESH, PAPI_REFRESH_VALUE ) == -1) {
2111 PAPIERROR("overflow refresh failed");
2112 }
2113}
int i
#define GET_OVERFLOW_ADDRESS(ctx)
Definition: aix-context.h:12
int _papi_hwi_dispatch_overflow_signal(void *papiContext, vptr_t address, int *isHardware, long long overflow_bit, int genOverflowBit, ThreadInfo_t **t, int cidx)
Definition: extras.c:216
#define PAPI_PROFILING
Definition: f90papi.h:150
#define PAPI_OVERFLOW_FORCE_SW
Definition: f90papi.h:131
#define PAPI_OVERFLOW_HARDWARE
Definition: f90papi.h:157
#define PAPI_PROFIL_FORCE_SW
Definition: f90papi.h:257
void * thread(void *arg)
Definition: kufrin.c:38
void * vptr_t
Definition: papi.h:576
void PAPIERROR(char *format,...)
static int cidx
papi_vector_t _perf_event_vector
Definition: perf_event.c:73
static int process_smpl_buf(int evt_idx, ThreadInfo_t **thr, int cidx)
Definition: perf_event.c:1944
#define PAPI_REFRESH_VALUE
Definition: perf_event.c:88
static uint64_t mmap_read_head(pe_event_info_t *pe)
Definition: perf_helpers.h:421
static void mmap_write_tail(pe_event_info_t *pe, uint64_t tail)
Definition: perf_helpers.h:438
hwd_siginfo_t * si
hwd_ucontext_t * ucontext
PAPI_component_info_t cmp_info
Definition: papi_vector.h:20
pe_event_info_t events[PERF_EVENT_MAX_MPX_COUNTERS]
inline_static ThreadInfo_t * _papi_hwi_lookup_thread(int custom_tid)
Definition: threads.h:97
Here is the call graph for this function:

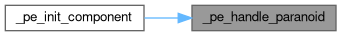
◆ _pe_handle_paranoid()

static int _pe_handle_paranoid ( papi_vector_t component)
static

Definition at line 2446 of file perf_event.c.

2446 {
2447
2448 FILE *fff;
2449 int paranoid_level;
2450 int retval;
2451 char *strCpy;
2452
2453 /* The is the official way to detect if perf_event support exists */
2454 /* The file is called perf_counter_paranoid on 2.6.31 */
2455 /* currently we are lazy and do not support 2.6.31 kernels */
2456
2457 fff=fopen("/proc/sys/kernel/perf_event_paranoid","r");
2458 if (fff==NULL) {
2459 strCpy=strncpy(component->cmp_info.disabled_reason,
2460 "perf_event support not detected",PAPI_MAX_STR_LEN);
2461 if (strCpy == NULL) HANDLE_STRING_ERROR;
2462 return PAPI_ECMP;
2463 }
2464
2465 /* 3 (vendor patch) means completely disabled */
2466 /* 2 means no kernel measurements allowed */
2467 /* 1 means normal counter access */
2468 /* 0 means you can access CPU-specific data */
2469 /* -1 means no restrictions */
2470 retval=fscanf(fff,"%d",&paranoid_level);
2471 if (retval!=1) fprintf(stderr,"Error reading paranoid level\n");
2472 fclose(fff);
2473
2474 if (paranoid_level==3) {
2475 strCpy=strncpy(component->cmp_info.disabled_reason,
2476 "perf_event support disabled by Linux with paranoid=3",PAPI_MAX_STR_LEN);
2477 if (strCpy == NULL) HANDLE_STRING_ERROR;
2478 return PAPI_ECMP;
2479 }
2480
2481 if ((paranoid_level==2) && (getuid()!=0)) {
2482 SUBDBG("/proc/sys/kernel/perf_event_paranoid prohibits kernel counts");
2483 component->cmp_info.available_domains &=~PAPI_DOM_KERNEL;
2484 }
2485
2486 return PAPI_OK;
2487
2488}
#define PAPI_MAX_STR_LEN
Definition: f90papi.h:77
FILE * fff[MAX_EVENTS]
FILE * stderr
int fclose(FILE *__stream)
#define HANDLE_STRING_ERROR
Definition: perf_event.c:70
char disabled_reason[PAPI_HUGE_STR_LEN]
Definition: papi.h:634
Here is the call graph for this function:
Here is the caller graph for this function:

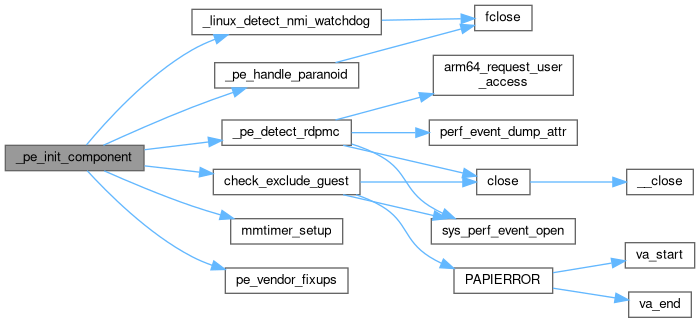
◆ _pe_init_component()

static int _pe_init_component ( int  cidx)
static

Definition at line 2536 of file perf_event.c.

2537{
2538
2539 int retval;
2540 char *strCpy;
2541
2542 our_cidx=cidx;
2543
2544 /* Update component behavior based on paranoid setting */
2546
2547 if (retval!=PAPI_OK) goto fn_fail; // disabled_reason handled by _pe_handle_paranoid.
2548
2549#if (OBSOLETE_WORKAROUNDS==1)
2550 /* Handle any kernel version related workarounds */
2551 _pe_version_workarounds(_papi_hwd[cidx]);
2552#endif
2553
2554 /* Setup mmtimers, if appropriate */
2556 if (retval) {
2557 strCpy=strncpy(_papi_hwd[cidx]->cmp_info.disabled_reason,
2558 "Error initializing mmtimer",PAPI_MAX_STR_LEN);
2559 if (strCpy == NULL) HANDLE_STRING_ERROR;
2560 goto fn_fail;
2561 }
2562
2563 /* Set the overflow signal */
2564 _papi_hwd[cidx]->cmp_info.hardware_intr_sig = SIGRTMIN + 2;
2565
2566 /* Run Vendor-specific fixups */
2568
2569 /* Detect if we can use rdpmc (or equivalent) */
2571 _papi_hwd[cidx]->cmp_info.fast_counter_read = retval;
2572 if (retval < 0 ) {
2573 /* Don't actually fail here, as could be a surivable bug? */
2574 /* If perf_event_open/mmap truly are failing we will */
2575 /* likely catch it pretty quickly elsewhere. */
2576 _papi_hwd[cidx]->cmp_info.fast_counter_read = 0;
2577 }
2578
2579#if (USE_PERFEVENT_RDPMC==1)
2580
2581#else
2582 /* Force fast_counter_read off if --enable-perfevent-rdpmc=no */
2583 _papi_hwd[cidx]->cmp_info.fast_counter_read = 0;
2584#endif
2585
2586 /* Run the libpfm4-specific setup */
2588 if (retval) {
2589 strCpy=strncpy(_papi_hwd[cidx]->cmp_info.disabled_reason,
2590 "Error initializing libpfm4",PAPI_MAX_STR_LEN);
2591 if (strCpy == NULL) HANDLE_STRING_ERROR;
2592 goto fn_fail;
2593
2594 }
2595
2596 /* Now that libpfm4 is initialized */
2597 /* Try to setup the perf_event component events */
2598
2602 if (retval) {
2603 switch(retval) {
2604 case PAPI_ENOMEM:
2605 strCpy=strncpy(_papi_hwd[cidx]->cmp_info.disabled_reason,
2606 "Error libpfm4 memory allocation",
2608 if (strCpy == NULL) HANDLE_STRING_ERROR;
2609 break;
2610 case PAPI_ENOSUPP:
2611 strCpy=strncpy(_papi_hwd[cidx]->cmp_info.disabled_reason,
2612 "Error libpfm4 no PMUs found",
2614 if (strCpy == NULL) HANDLE_STRING_ERROR;
2615 break;
2616 case PAPI_ECMP:
2617 strCpy=strncpy(_papi_hwd[cidx]->cmp_info.disabled_reason,
2618 "Error libpfm4 no default PMU found",
2620 if (strCpy == NULL) HANDLE_STRING_ERROR;
2621 break;
2622 case PAPI_ECOUNT:
2623 strCpy=strncpy(_papi_hwd[cidx]->cmp_info.disabled_reason,
2624 "Error libpfm4 too many default PMUs found",
2626 if (strCpy == NULL) HANDLE_STRING_ERROR;
2627 break;
2628 case PAPI_ENOEVNT:
2629 strCpy=strncpy(_papi_hwd[cidx]->cmp_info.disabled_reason,
2630 "Error loading preset events",
2632 if (strCpy == NULL) HANDLE_STRING_ERROR;
2633 break;
2634 default:
2635 strCpy=strncpy(_papi_hwd[cidx]->cmp_info.disabled_reason,
2636 "Unknown libpfm4 related error",
2638 if (strCpy == NULL) HANDLE_STRING_ERROR;
2639
2640 }
2641 goto fn_fail;
2642 }
2643
2644 /* Detect NMI watchdog which can steal counters */
2645 /* FIXME: on Intel we should also halve the count if SMT enabled */
2647 if (_papi_hwd[cidx]->cmp_info.num_cntrs>0) {
2648 _papi_hwd[cidx]->cmp_info.num_cntrs--;
2649 }
2650 SUBDBG("The Linux nmi_watchdog is using one of the performance "
2651 "counters, reducing the total number available.\n");
2652 }
2653
2654 /* check for exclude_guest issue */
2656
2657 fn_exit:
2658 _papi_hwd[cidx]->cmp_info.disabled = retval;
2659 return retval;
2660 fn_fail:
2661 goto fn_exit;
2662
2663}
Initialize the libpfm4 code.
struct papi_vectors * _papi_hwd[]
#define PAPI_ENOEVNT
Definition: f90papi.h:139
#define PAPI_ECOUNT
Definition: f90papi.h:195
#define PAPI_ENOMEM
Definition: f90papi.h:16
int _linux_detect_nmi_watchdog()
Definition: linux-common.c:768
int mmtimer_setup(void)
Definition: linux-timer.c:130
#define PMU_TYPE_OS
#define PMU_TYPE_CORE
static int _pe_detect_rdpmc(void)
Definition: perf_event.c:2357
void check_exclude_guest(void)
Definition: perf_event.c:278
static int _pe_handle_paranoid(papi_vector_t *component)
Definition: perf_event.c:2446
struct native_event_table_t perf_native_event_table
Definition: perf_event.c:76
static int our_cidx
Definition: perf_event.c:77
static int pe_vendor_fixups(papi_vector_t *vector)
Definition: perf_event.c:117
Here is the call graph for this function:

◆ _pe_init_control_state()

static int _pe_init_control_state ( hwd_control_state_t ctl)
static

Definition at line 1843 of file perf_event.c.

1844{
1845 pe_control_t *pe_ctl = ( pe_control_t *) ctl;
1846
1847 /* clear the contents */
1848 memset( pe_ctl, 0, sizeof ( pe_control_t ) );
1849
1850 /* Set the domain */
1852
1853 /* default granularity */
1855
1856 /* overflow signal */
1858
1859 pe_ctl->cidx=our_cidx;
1860
1861 /* Set cpu number in the control block to show events */
1862 /* are not tied to specific cpu */
1863 pe_ctl->cpu = -1;
1864
1865 return PAPI_OK;
1866}
static int _pe_set_domain(hwd_control_state_t *ctl, int domain)
Definition: perf_event.c:1008
int default_granularity
Definition: papi.h:644
unsigned int overflow_signal
Here is the call graph for this function:

◆ _pe_init_thread()

static int _pe_init_thread ( hwd_context_t hwd_ctx)
static

Definition at line 1034 of file perf_event.c.

1035{
1036
1037 pe_context_t *pe_ctx = ( pe_context_t *) hwd_ctx;
1038
1039 /* clear the context structure and mark as initialized */
1040 memset( pe_ctx, 0, sizeof ( pe_context_t ) );
1041 pe_ctx->initialized=1;
1043 pe_ctx->cidx=our_cidx;
1044
1045 return PAPI_OK;
1046}
struct native_event_table_t * event_table

◆ _pe_ntv_code_to_descr()

static int _pe_ntv_code_to_descr ( unsigned int  EventCode,
char *  ntv_descr,
int  len 
)
static

Definition at line 1895 of file perf_event.c.

1897{
1898
1899 return _pe_libpfm4_ntv_code_to_descr(EventCode,ntv_descr,len,
1901}
Take an event code and convert it to a description.

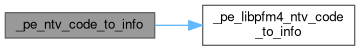
◆ _pe_ntv_code_to_info()

static int _pe_ntv_code_to_info ( unsigned int  EventCode,
PAPI_event_info_t info 
)
static

Definition at line 1904 of file perf_event.c.

1905 {
1906
1907 return _pe_libpfm4_ntv_code_to_info(EventCode, info,
1909}
int _pe_libpfm4_ntv_code_to_info(unsigned int EventCode, PAPI_event_info_t *info, struct native_event_table_t *event_table)
Here is the call graph for this function:

◆ _pe_ntv_code_to_name()

static int _pe_ntv_code_to_name ( unsigned int  EventCode,
char *  ntv_name,
int  len 
)
static

Definition at line 1886 of file perf_event.c.

1888{
1889 return _pe_libpfm4_ntv_code_to_name(EventCode,
1890 ntv_name, len,
1892}
Take an event code and convert it to a name.

◆ _pe_ntv_enum_events()

static int _pe_ntv_enum_events ( unsigned int PapiEventCode,
int  modifier 
)
static

Definition at line 1872 of file perf_event.c.

1873{
1874 return _pe_libpfm4_ntv_enum_events(PapiEventCode, modifier, our_cidx,
1876}
Walk through all events in a pre-defined order.

◆ _pe_ntv_name_to_code()

static int _pe_ntv_name_to_code ( const char *  name,
unsigned int event_code 
)
static

Definition at line 1879 of file perf_event.c.

1880{
1881 return _pe_libpfm4_ntv_name_to_code(name,event_code, our_cidx,
1883}
Take an event name and convert it to an event code.
const char * name
Definition: rocs.c:225

◆ _pe_rdpmc_read()

static int _pe_rdpmc_read ( hwd_context_t ctx,
hwd_control_state_t ctl,
long long **  events,
int  flags 
)
static

Definition at line 1126 of file perf_event.c.
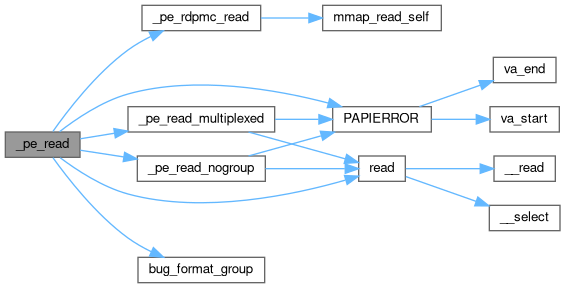
1128{
1129 long long papi_pe_buffer[READ_BUFFER_SIZE];
1130
1131 SUBDBG("ENTER: ctx: %p, ctl: %p, events: %p, flags: %#x\n",
1132 ctx, ctl, events, flags);
1133
1134 ( void ) flags; /*unused */
1135 ( void ) ctx; /*unused */
1136 ( void ) papi_pe_buffer; /*unused */
1137 int i;
1138 pe_control_t *pe_ctl = ( pe_control_t *) ctl;
1139 unsigned long long count, enabled = 0, running = 0, adjusted;
1140 int errors=0;
1141
1142 /* we must read each counter individually */
1143 for ( i = 0; i < pe_ctl->num_events; i++ ) {
1144
1146 pe_ctl->reset_flag,
1147 pe_ctl->reset_counts[i],
1148 &enabled,&running);
1149
1150 if (count==0xffffffffffffffffULL) {
1151 errors++;
1152 }
1153
1154 /* Handle multiplexing case */
1155 if (enabled == running) {
1156 /* no adjustment needed */
1157 }
1158 else if (enabled && running) {
1159 adjusted = (enabled * 128LL) / running;
1160 adjusted = adjusted * count;
1161 adjusted = adjusted / 128LL;
1162 count = adjusted;
1163 } else {
1164 /* This should not happen, but we have had it reported */
1165 SUBDBG("perf_event kernel bug(?) count, enabled, "
1166 "running: %lld, %lld, %lld\n",
1167 papi_pe_buffer[0],enabled,running);
1168
1169 }
1170
1171 pe_ctl->counts[i] = count;
1172 }
1173 /* point PAPI to the values we read */
1174 *events = pe_ctl->counts;
1175
1176 SUBDBG("EXIT: *events: %p\n", *events);
1177
1178 if (errors) return PAPI_ESYS;
1179
1180 return PAPI_OK;
1181}
static long count
char events[MAX_EVENTS][BUFSIZ]
#define READ_BUFFER_SIZE
Definition: perf_event.c:500
static unsigned long long mmap_read_self(void *addr __attribute__((unused)), int user_reset_flag __attribute__((unused)), unsigned long long reset __attribute__((unused)), unsigned long long *en __attribute__((unused)), unsigned long long *ru __attribute__((unused)))
Definition: perf_helpers.h:398
long long reset_counts[PERF_EVENT_MAX_MPX_COUNTERS]
unsigned int reset_flag
long long counts[PERF_EVENT_MAX_MPX_COUNTERS]
Here is the call graph for this function:
Here is the caller graph for this function:

◆ _pe_read()

static int _pe_read ( hwd_context_t ctx,
hwd_control_state_t ctl,
long long **  events,
int  flags 
)
static

Definition at line 1295 of file perf_event.c.

1297{
1298 SUBDBG("ENTER: ctx: %p, ctl: %p, events: %p, flags: %#x\n",
1299 ctx, ctl, events, flags);
1300
1301 ( void ) flags; /*unused */
1302 ( void ) ctx; /*unused */
1303 int i, j, ret = -1;
1304 pe_control_t *pe_ctl = ( pe_control_t *) ctl;
1305 long long papi_pe_buffer[READ_BUFFER_SIZE];
1306 int result;
1307
1308 /* Handle fast case */
1309 /* FIXME: we fallback to slow reads if *any* event in eventset fails */
1310 /* in theory we could only fall back for the one event */
1311 /* but that makes the code more complicated. */
1313 (!pe_ctl->inherit) &&
1314 (!pe_ctl->attached) &&
1315 (pe_ctl->granularity==PAPI_GRN_THR)) {
1316 result=_pe_rdpmc_read( ctx, ctl, events, flags);
1317 /* if successful we are done, otherwise fall back to read */
1318 if (result==PAPI_OK) return PAPI_OK;
1319 }
1320
1321 /* Handle case where we are multiplexing */
1322 if (pe_ctl->multiplexed) {
1323 _pe_read_multiplexed(pe_ctl);
1324 }
1325
1326 /* Handle cases where we cannot use FORMAT GROUP */
1327 else if (bug_format_group() || pe_ctl->inherit) {
1328 _pe_read_nogroup(pe_ctl);
1329 }
1330
1331 /* Handle common case where we are using FORMAT_GROUP */
1332 /* We assume only one group leader, in position 0 */
1333
1334 /* By reading the leader file descriptor, we get a series */
1335 /* of 64-bit values. The first is the total number of */
1336 /* events, followed by the counts for them. */
1337
1338 else {
1339 if (pe_ctl->events[0].group_leader_fd!=-1) {
1340 PAPIERROR("Was expecting group leader");
1341 }
1342
1343 ret = read( pe_ctl->events[0].event_fd,
1344 papi_pe_buffer,
1345 sizeof ( papi_pe_buffer ) );
1346
1347 if ( ret == -1 ) {
1348 PAPIERROR("read returned an error: %s",
1349 strerror( errno ));
1350 return PAPI_ESYS;
1351 }
1352
1353 /* we read 1 64-bit value (number of events) then */
1354 /* num_events more 64-bit values that hold the counts */
1355 if (ret<(signed)((1+pe_ctl->num_events)*sizeof(long long))) {
1356 PAPIERROR("Error! short read");
1357 return PAPI_ESYS;
1358 }
1359
1360 SUBDBG("read: fd: %2d, tid: %ld, cpu: %d, ret: %d\n",
1361 pe_ctl->events[0].event_fd,
1362 (long)pe_ctl->tid, pe_ctl->events[0].cpu, ret);
1363
1364 for(j=0;j<ret/8;j++) {
1365 SUBDBG("read %d: %lld\n",j,papi_pe_buffer[j]);
1366 }
1367
1368 /* Make sure the kernel agrees with how many events we have */
1369 if (papi_pe_buffer[0]!=pe_ctl->num_events) {
1370 PAPIERROR("Error! Wrong number of events");
1371 return PAPI_ESYS;
1372 }
1373
1374 /* put the count values in their proper location */
1375 for(i=0;i<pe_ctl->num_events;i++) {
1376 pe_ctl->counts[i] = papi_pe_buffer[1+i];
1377 }
1378 }
1379
1380 /* point PAPI to the values we read */
1381 *events = pe_ctl->counts;
1382
1383 SUBDBG("EXIT: *events: %p\n", *events);
1384
1385 return PAPI_OK;
1386}
volatile int result
int errno
ssize_t read(int fd, void *buf, size_t count)
Definition: appio.c:229
static int _pe_rdpmc_read(hwd_context_t *ctx, hwd_control_state_t *ctl, long long **events, int flags)
Definition: perf_event.c:1126
static int bug_format_group(void)
Definition: perf_event.c:181
static int _pe_read_nogroup(pe_control_t *pe_ctl)
Definition: perf_event.c:1257
static int _pe_read_multiplexed(pe_control_t *pe_ctl)
Definition: perf_event.c:1185
unsigned int fast_counter_read
Definition: papi.h:655
Here is the call graph for this function:

◆ _pe_read_multiplexed()

static int _pe_read_multiplexed ( pe_control_t pe_ctl)
static

Definition at line 1185 of file perf_event.c.

1186{
1187 int i,ret=-1;
1188 long long papi_pe_buffer[READ_BUFFER_SIZE];
1189 long long tot_time_running, tot_time_enabled, scale;
1190
1191 /* perf_event does not support FORMAT_GROUP on multiplex */
1192 /* so we have to handle separate events when multiplexing */
1193
1194 for ( i = 0; i < pe_ctl->num_events; i++ ) {
1195
1196 ret = read( pe_ctl->events[i].event_fd,
1197 papi_pe_buffer,
1198 sizeof ( papi_pe_buffer ) );
1199 if ( ret == -1 ) {
1200 PAPIERROR("read returned an error: %s",
1201 strerror( errno ));
1202 return PAPI_ESYS;
1203 }
1204
1205 /* We should read 3 64-bit values from the counter */
1206 if (ret<(signed)(3*sizeof(long long))) {
1207 PAPIERROR("Error! short read");
1208 return PAPI_ESYS;
1209 }
1210
1211 SUBDBG("read: fd: %2d, tid: %ld, cpu: %d, ret: %d\n",
1212 pe_ctl->events[i].event_fd,
1213 (long)pe_ctl->tid, pe_ctl->events[i].cpu, ret);
1214 SUBDBG("read: %lld %lld %lld\n",
1215 papi_pe_buffer[0],
1216 papi_pe_buffer[1],
1217 papi_pe_buffer[2]);
1218
1219 tot_time_enabled = papi_pe_buffer[1];
1220 tot_time_running = papi_pe_buffer[2];
1221
1222 SUBDBG("count[%d] = (papi_pe_buffer[%d] %lld * "
1223 "tot_time_enabled %lld) / "
1224 "tot_time_running %lld\n",
1225 i, 0,papi_pe_buffer[0],
1226 tot_time_enabled,tot_time_running);
1227
1228 if (tot_time_running == tot_time_enabled) {
1229 /* No scaling needed */
1230 pe_ctl->counts[i] = papi_pe_buffer[0];
1231 } else if (tot_time_running && tot_time_enabled) {
1232 /* Scale to give better results */
1233 /* avoid truncation. */
1234 /* Why use 100? Would 128 be faster? */
1235 scale = (tot_time_enabled * 100LL) / tot_time_running;
1236 scale = scale * papi_pe_buffer[0];
1237 scale = scale / 100LL;
1238 pe_ctl->counts[i] = scale;
1239 } else {
1240 /* This should not happen, but Phil reports it sometime does. */
1241 SUBDBG("perf_event kernel bug(?) count, enabled, "
1242 "running: %lld, %lld, %lld\n",
1243 papi_pe_buffer[0],tot_time_enabled,
1244 tot_time_running);
1245
1246 pe_ctl->counts[i] = papi_pe_buffer[0];
1247 }
1248 }
1249 return PAPI_OK;
1250}
Here is the call graph for this function:
Here is the caller graph for this function:

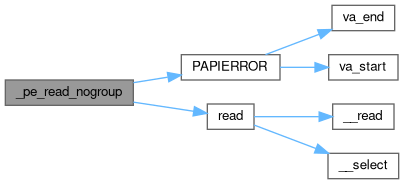
◆ _pe_read_nogroup()

static int _pe_read_nogroup ( pe_control_t pe_ctl)
static

Definition at line 1257 of file perf_event.c.

1257 {
1258
1259 int i,ret=-1;
1260 long long papi_pe_buffer[READ_BUFFER_SIZE];
1261
1262 /* we must read each counter individually */
1263 for ( i = 0; i < pe_ctl->num_events; i++ ) {
1264 ret = read( pe_ctl->events[i].event_fd,
1265 papi_pe_buffer,
1266 sizeof ( papi_pe_buffer ) );
1267 if ( ret == -1 ) {
1268 PAPIERROR("read returned an error: %s",
1269 strerror( errno ));
1270 return PAPI_ESYS;
1271 }
1272
1273 /* we should read one 64-bit value from each counter */
1274 if (ret!=sizeof(long long)) {
1275 PAPIERROR("Error! short read");
1276 PAPIERROR("read: fd: %2d, tid: %ld, cpu: %d, ret: %d",
1277 pe_ctl->events[i].event_fd,
1278 (long)pe_ctl->tid, pe_ctl->events[i].cpu, ret);
1279 return PAPI_ESYS;
1280 }
1281
1282 SUBDBG("read: fd: %2d, tid: %ld, cpu: %d, ret: %d\n",
1283 pe_ctl->events[i].event_fd, (long)pe_ctl->tid,
1284 pe_ctl->events[i].cpu, ret);
1285 SUBDBG("read: %lld\n",papi_pe_buffer[0]);
1286
1287 pe_ctl->counts[i] = papi_pe_buffer[0];
1288 }
1289
1290 return PAPI_OK;
1291
1292}
Here is the call graph for this function:
Here is the caller graph for this function:

◆ _pe_reset()

static int _pe_reset ( hwd_context_t ctx,
hwd_control_state_t ctl 
)
static

Definition at line 1057 of file perf_event.c.

1058{
1059 int i, ret;
1060 pe_control_t *pe_ctl = ( pe_control_t *) ctl;
1061
1062 ( void ) ctx; /*unused */
1063
1064 /* We need to reset all of the events, not just the group leaders */
1065 for( i = 0; i < pe_ctl->num_events; i++ ) {
1067 ret = ioctl( pe_ctl->events[i].event_fd,
1068 PERF_EVENT_IOC_RESET, NULL );
1070 pe_ctl->events[i].mmap_buf);
1071 pe_ctl->reset_flag = 1;
1072 } else {
1073 ret = ioctl( pe_ctl->events[i].event_fd,
1074 PERF_EVENT_IOC_RESET, NULL );
1075 }
1076 if ( ret == -1 ) {
1077 PAPIERROR("ioctl(%d, PERF_EVENT_IOC_RESET, NULL) "
1078 "returned error, Linux says: %s",
1079 pe_ctl->events[i].event_fd,
1080 strerror( errno ) );
1081 return PAPI_ESYS;
1082 }
1083 }
1084
1085 return PAPI_OK;
1086}
static unsigned long long mmap_read_reset_count(void *addr __attribute__((unused)))
Definition: perf_helpers.h:407
Here is the call graph for this function:
Here is the caller graph for this function:

◆ _pe_set_domain()

static int _pe_set_domain ( hwd_control_state_t ctl,
int  domain 
)
static

Definition at line 1008 of file perf_event.c.

1009{
1010 pe_control_t *pe_ctl = ( pe_control_t *) ctl;
1011
1012 SUBDBG("old control domain %d, new domain %d\n", pe_ctl->domain,domain);
1013 pe_ctl->domain = domain;
1014 return PAPI_OK;
1015}
Here is the caller graph for this function:

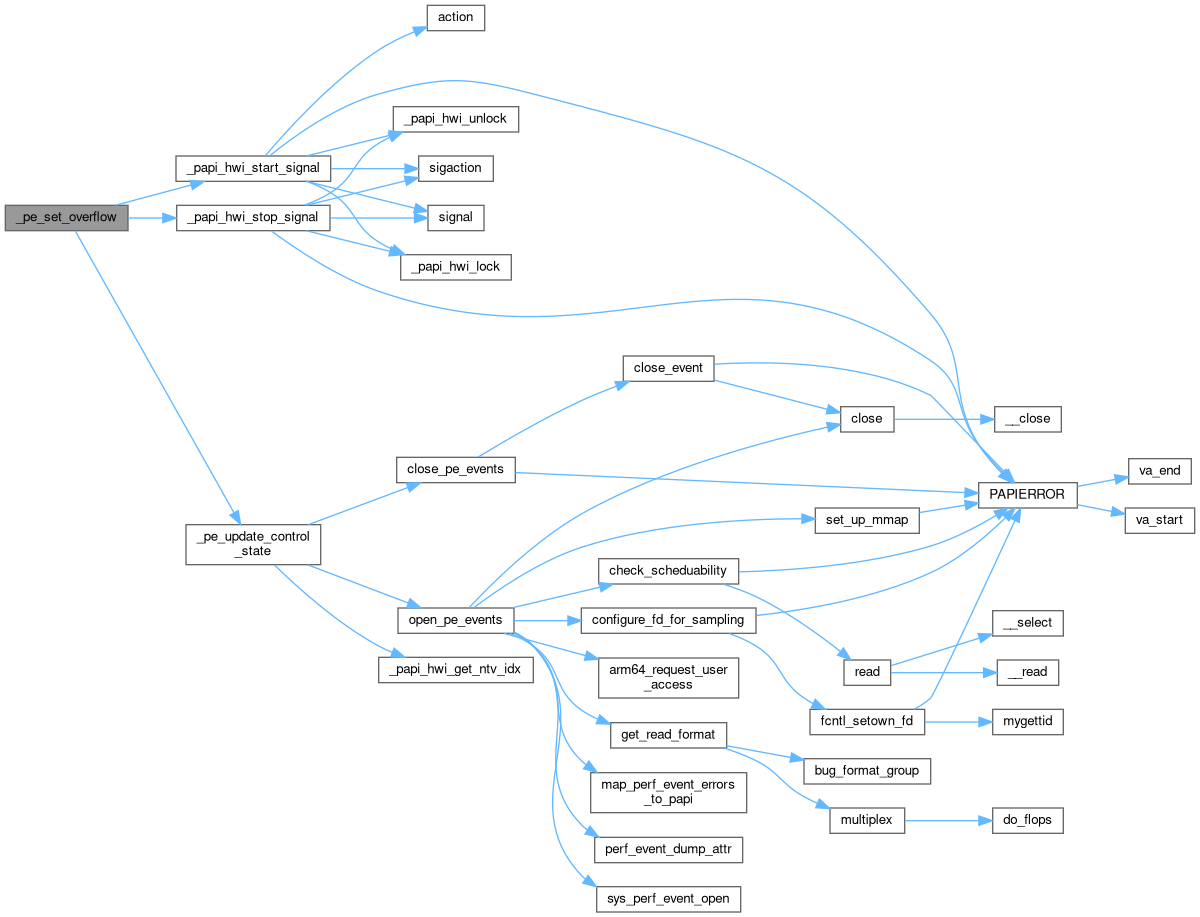
◆ _pe_set_overflow()

static int _pe_set_overflow ( EventSetInfo_t ESI,
int  EventIndex,
int  threshold 
)
static

Definition at line 2152 of file perf_event.c.

2153{
2154 SUBDBG("ENTER: ESI: %p, EventIndex: %d, threshold: %d\n",
2155 ESI, EventIndex, threshold);
2156
2157 pe_context_t *ctx;
2158 pe_control_t *ctl = (pe_control_t *) ( ESI->ctl_state );
2159 int i, evt_idx, found_non_zero_sample_period = 0, retval = PAPI_OK;
2160 int cidx;
2161
2162 cidx = ctl->cidx;
2163 ctx = ( pe_context_t *) ( ESI->master->context[cidx] );
2164
2165 /* pos[0] is the first native event */
2166 /* derived events might be made up of multiple native events */
2167 evt_idx = ESI->EventInfoArray[EventIndex].pos[0];
2168
2169 SUBDBG("Attempting to set overflow for index %d (%d) of EventSet %d\n",
2170 evt_idx,EventIndex,ESI->EventSetIndex);
2171
2172 if (evt_idx<0) {
2173 SUBDBG("EXIT: evt_idx: %d\n", evt_idx);
2174 return PAPI_EINVAL;
2175 }
2176
2177 /* It's an error to disable overflow if it wasn't set in the */
2178 /* first place. */
2179 if (( threshold == 0 ) &&
2180 ( ctl->events[evt_idx].attr.sample_period == 0 ) ) {
2181 SUBDBG("EXIT: PAPI_EINVAL, Tried to clear "
2182 "sample threshold when it was not set\n");
2183 return PAPI_EINVAL;
2184 }
2185
2186 /* Set the sample period to threshold */
2187 ctl->events[evt_idx].attr.sample_period = threshold;
2188
2189 if (threshold == 0) {
2190 ctl->events[evt_idx].sampling = 0;
2191 }
2192 else {
2193 ctl->events[evt_idx].sampling = 1;
2194
2195 /* Setting wakeup_events to one means issue a wakeup on every */
2196 /* counter overflow (not mmap page overflow). */
2197 ctl->events[evt_idx].attr.wakeup_events = 1;
2198 /* We need the IP to pass to the overflow handler */
2199 ctl->events[evt_idx].attr.sample_type = PERF_SAMPLE_IP;
2200 }
2201
2202
2203 /* Check to see if any events in the EventSet are setup to sample */
2204 /* Do we actually handle multiple overflow events at once? --vmw */
2205 for ( i = 0; i < ctl->num_events; i++ ) {
2206 if ( ctl->events[i].attr.sample_period ) {
2207 found_non_zero_sample_period = 1;
2208 break;
2209 }
2210 }
2211
2212 if ( found_non_zero_sample_period ) {
2213 /* turn on internal overflow flag for this event set */
2214 ctl->overflow = 1;
2215
2216 /* Enable the signal handler */
2218 ctl->overflow_signal,
2219 1, ctl->cidx );
2220 if (retval != PAPI_OK) {
2221 SUBDBG("Call to _papi_hwi_start_signal "
2222 "returned: %d\n", retval);
2223 }
2224 } else {
2225
2226 /* turn off internal overflow flag for this event set */
2227 ctl->overflow = 0;
2228
2229 /* Remove the signal handler, if there are no remaining */
2230 /* non-zero sample_periods set */
2232 if ( retval != PAPI_OK ) {
2233 SUBDBG("Call to _papi_hwi_stop_signal "
2234 "returned: %d\n", retval);
2235 return retval;
2236 }
2237 }
2238
2239 retval = _pe_update_control_state( ctl, NULL,
2240 ((pe_control_t *)(ESI->ctl_state) )->num_events,
2241 ctx );
2242
2243 SUBDBG("EXIT: return: %d\n", retval);
2244
2245 return retval;
2246}
int _papi_hwi_start_signal(int signal, int need_context, int cidx)
Definition: extras.c:403
int _papi_hwi_stop_signal(int signal)
Definition: extras.c:443
static int threshold
int pos[PAPI_EVENTS_IN_DERIVED_EVENT]
struct _ThreadInfo * master
EventInfo_t * EventInfoArray
unsigned int overflow
struct perf_event_attr attr
Here is the call graph for this function:
Here is the caller graph for this function:

◆ _pe_set_profile()

static int _pe_set_profile ( EventSetInfo_t ESI,
int  EventIndex,
int  threshold 
)
static

Definition at line 2251 of file perf_event.c.

2252{
2253 int ret;
2254 int evt_idx;
2255 pe_control_t *ctl = ( pe_control_t *) ( ESI->ctl_state );
2256
2257 /* Since you can't profile on a derived event, */
2258 /* the event is always the first and only event */
2259 /* in the native event list. */
2260 evt_idx = ESI->EventInfoArray[EventIndex].pos[0];
2261
2262 /* If threshold is zero we want to *disable* */
2263 /* profiling on the event */
2264 if ( threshold == 0 ) {
2265// SUBDBG( "MUNMAP(%p,%"PRIu64")\n",
2266// ctl->events[evt_idx].mmap_buf,
2267// ( uint64_t ) ctl->events[evt_idx].nr_mmap_pages *
2268// getpagesize() );
2269
2270// if ( ctl->events[evt_idx].mmap_buf ) {
2271// munmap( ctl->events[evt_idx].mmap_buf,
2272// ctl->events[evt_idx].nr_mmap_pages *
2273// getpagesize() );
2274// }
2275// ctl->events[evt_idx].mmap_buf = NULL;
2276// ctl->events[evt_idx].nr_mmap_pages = 0;
2277
2278 /* no longer sample on IP */
2279 ctl->events[evt_idx].attr.sample_type &= ~PERF_SAMPLE_IP;
2280
2281 /* Clear any residual overflow flags */
2282 /* ??? old warning says "This should be handled somewhere else" */
2283 ESI->state &= ~( PAPI_OVERFLOWING );
2285
2286 ctl->events[evt_idx].profiling=0;
2287
2288 } else {
2289
2290 /* Otherwise, we are *enabling* profiling */
2291
2292 /* Look up the native event code */
2293
2294 if ( ESI->profile.flags & (PAPI_PROFIL_DATA_EAR |
2296 /* Not supported yet... */
2297 return PAPI_ENOSUPP;
2298 }
2299
2300 if ( ESI->profile.flags & PAPI_PROFIL_RANDOM ) {
2301 /* This requires an ability to randomly alter the */
2302 /* sample_period within a given range. */
2303 /* Linux currently does not have this ability. FIXME */
2304 return PAPI_ENOSUPP;
2305 }
2306 ctl->events[evt_idx].profiling=1;
2307 }
2308
2309 ret = _pe_set_overflow( ESI, EventIndex, threshold );
2310 if ( ret != PAPI_OK ) return ret;
2311
2312 return PAPI_OK;
2313}
#define PAPI_PROFIL_INST_EAR
Definition: f90papi.h:206
#define PAPI_OVERFLOWING
Definition: f90papi.h:240
#define PAPI_PROFIL_RANDOM
Definition: f90papi.h:143
#define PAPI_PROFIL_DATA_EAR
Definition: f90papi.h:127
static int _pe_set_overflow(EventSetInfo_t *ESI, int EventIndex, int threshold)
Definition: perf_event.c:2152
EventSetProfileInfo_t profile
EventSetOverflowInfo_t overflow
Here is the call graph for this function:

◆ _pe_shutdown_component()

static int _pe_shutdown_component ( void  )
static

Definition at line 2321 of file perf_event.c.

2321 {
2322
2323 /* deallocate our event table */
2325
2326 /* Shutdown libpfm4 */
2328
2329 return PAPI_OK;
2330}
Shutdown any initialization done by the libpfm4 code.

◆ _pe_shutdown_thread()

static int _pe_shutdown_thread ( hwd_context_t ctx)
static

Definition at line 1023 of file perf_event.c.

1024{
1025 pe_context_t *pe_ctx = ( pe_context_t *) ctx;
1026
1027 pe_ctx->initialized=0;
1028
1029 return PAPI_OK;
1030}

◆ _pe_start()

static int _pe_start ( hwd_context_t ctx,
hwd_control_state_t ctl 
)
static

Definition at line 1448 of file perf_event.c.
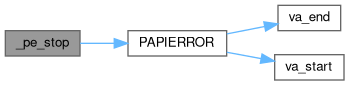
1449{
1450 int ret;
1451 int i;
1452 int did_something = 0;
1453 pe_context_t *pe_ctx = ( pe_context_t *) ctx;
1454 pe_control_t *pe_ctl = ( pe_control_t *) ctl;
1455
1456 /* Reset the counters first. Is this necessary? */
1457 ret = _pe_reset( pe_ctx, pe_ctl );
1458 if ( ret ) {
1459 return ret;
1460 }
1461
1462 /* Enable all of the group leaders */
1463 /* All group leaders have a group_leader_fd of -1 */
1464 for( i = 0; i < pe_ctl->num_events; i++ ) {
1465 if (pe_ctl->events[i].group_leader_fd == -1) {
1466 SUBDBG("ioctl(enable): fd: %d\n",
1467 pe_ctl->events[i].event_fd);
1468 ret=ioctl( pe_ctl->events[i].event_fd,
1469 PERF_EVENT_IOC_ENABLE, NULL) ;
1471 pe_ctl->reset_counts[i] = 0LL;
1472 pe_ctl->reset_flag = 0;
1473 }
1474
1475 /* ioctls always return -1 on failure */
1476 if (ret == -1) {
1477 PAPIERROR("ioctl(PERF_EVENT_IOC_ENABLE) failed");
1478 return PAPI_ESYS;
1479 }
1480
1481 did_something++;
1482 }
1483 }
1484
1485 if (!did_something) {
1486 PAPIERROR("Did not enable any counters");
1487 return PAPI_EBUG;
1488 }
1489
1490 pe_ctx->state |= PERF_EVENTS_RUNNING;
1491
1492 return PAPI_OK;
1493
1494}
#define PAPI_EBUG
Definition: f90papi.h:176
static int _pe_reset(hwd_context_t *ctx, hwd_control_state_t *ctl)
Definition: perf_event.c:1057
#define PERF_EVENTS_RUNNING
Definition: perf_event.c:65
Here is the call graph for this function:

◆ _pe_stop()

static int _pe_stop ( hwd_context_t ctx,
hwd_control_state_t ctl 
)
static

Definition at line 1498 of file perf_event.c.

1499{
1500 SUBDBG( "ENTER: ctx: %p, ctl: %p\n", ctx, ctl);
1501
1502 int ret;
1503 int i;
1504 pe_context_t *pe_ctx = ( pe_context_t *) ctx;
1505 pe_control_t *pe_ctl = ( pe_control_t *) ctl;
1506
1507 /* Just disable the group leaders */
1508 for ( i = 0; i < pe_ctl->num_events; i++ ) {
1509 if ( pe_ctl->events[i].group_leader_fd == -1 ) {
1510 ret=ioctl( pe_ctl->events[i].event_fd,
1511 PERF_EVENT_IOC_DISABLE, NULL);
1512 if ( ret == -1 ) {
1513 PAPIERROR( "ioctl(%d, PERF_EVENT_IOC_DISABLE, NULL) "
1514 "returned error, Linux says: %s",
1515 pe_ctl->events[i].event_fd, strerror( errno ) );
1516 return PAPI_EBUG;
1517 }
1518 }
1519 }
1520
1521 pe_ctx->state &= ~PERF_EVENTS_RUNNING;
1522
1523 SUBDBG( "EXIT:\n");
1524
1525 return PAPI_OK;
1526}
Here is the call graph for this function:

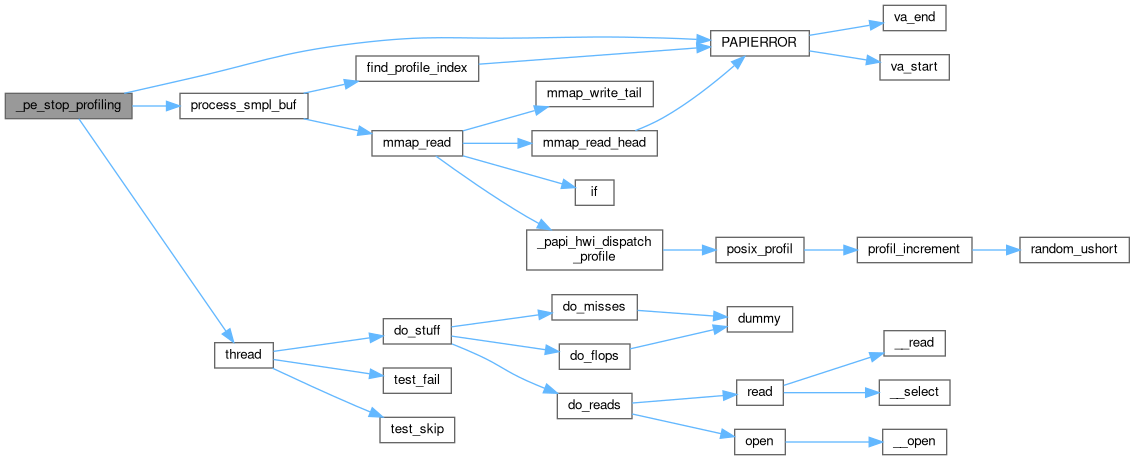
◆ _pe_stop_profiling()

static int _pe_stop_profiling ( ThreadInfo_t thread,
EventSetInfo_t ESI 
)
static

Definition at line 2120 of file perf_event.c.

2121{
2122 int i, ret = PAPI_OK;
2123 pe_control_t *ctl;
2124 int cidx;
2125
2126 ctl=ESI->ctl_state;
2127
2128 cidx=ctl->cidx;
2129
2130 /* Loop through all of the events and process those which have mmap */
2131 /* buffers attached. */
2132 for ( i = 0; i < ctl->num_events; i++ ) {
2133 /* Use the mmap_buf field as an indicator */
2134 /* of this fd being used for profiling. */
2135 if ( ctl->events[i].profiling ) {
2136 /* Process any remaining samples in the sample buffer */
2137 ret = process_smpl_buf( i, &thread, cidx );
2138 if ( ret ) {
2139 PAPIERROR( "process_smpl_buf returned error %d", ret );
2140 return ret;
2141 }
2142 ctl->events[i].profiling=0;
2143 }
2144 }
2145
2146 return ret;
2147}
Here is the call graph for this function:

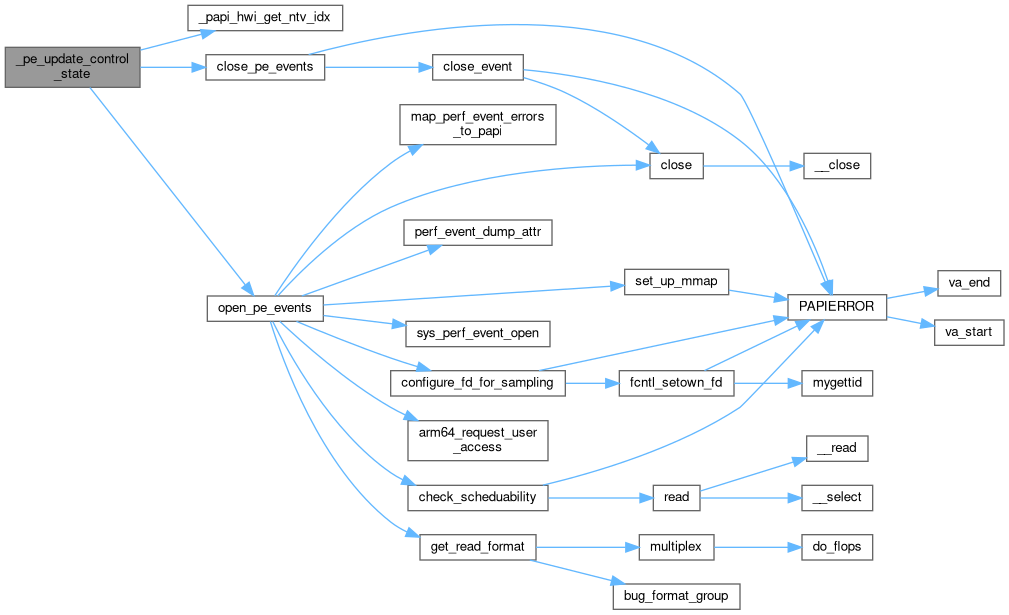
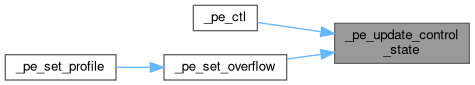
◆ _pe_update_control_state()

static int _pe_update_control_state ( hwd_control_state_t ctl,
NativeInfo_t native,
int  count,
hwd_context_t ctx 
)
static

Definition at line 1540 of file perf_event.c.

1543{
1544 SUBDBG( "ENTER: ctl: %p, native: %p, count: %d, ctx: %p\n",
1545 ctl, native, count, ctx);
1546 int i;
1547 int j;
1548 int ret;
1549 int skipped_events=0;
1550 struct native_event_t *ntv_evt;
1551 pe_context_t *pe_ctx = ( pe_context_t *) ctx;
1552 pe_control_t *pe_ctl = ( pe_control_t *) ctl;
1553
1554 /* close all of the existing fds and start over again */
1555 /* In theory we could have finer-grained control and know if */
1556 /* things were changed, but it's easier to tear things down and rebuild. */
1557 close_pe_events( pe_ctx, pe_ctl );
1558
1559 /* Calling with count==0 should be OK, it's how things are deallocated */
1560 /* when an eventset is destroyed. */
1561 if ( count == 0 ) {
1562 SUBDBG( "EXIT: Called with count == 0\n" );
1563 return PAPI_OK;
1564 }
1565
1566 /* set up all the events */
1567 for( i = 0; i < count; i++ ) {
1568 if ( native ) {
1569 /* get the native event pointer used for this papi event */
1570 int ntv_idx = _papi_hwi_get_ntv_idx((unsigned)(native[i].ni_papi_code));
1571 if (ntv_idx < -1) {
1572 SUBDBG("papi_event_code: %#x known by papi but not by the component\n", native[i].ni_papi_code);
1573 continue;
1574 }
1575 /* if native index is -1, then we have an event without a mask and need to find the right native index to use */
1576 if (ntv_idx == -1) {
1577 /* find the native event index we want by matching for the right papi event code */
1578 for (j=0 ; j<pe_ctx->event_table->num_native_events ; j++) {
1579 if (pe_ctx->event_table->native_events[j].papi_event_code == native[i].ni_papi_code) {
1580 ntv_idx = j;
1581 }
1582 }
1583 }
1584
1585 /* if native index is still negative, we did not find event we wanted so just return error */
1586 if (ntv_idx < 0) {
1587 SUBDBG("papi_event_code: %#x not found in native event tables\n", native[i].ni_papi_code);
1588 continue;
1589 }
1590
1591 /* this native index is positive so there was a mask with the event, the ntv_idx identifies which native event to use */
1592 ntv_evt = (struct native_event_t *)(&(pe_ctx->event_table->native_events[ntv_idx]));
1593 SUBDBG("ntv_evt: %p\n", ntv_evt);
1594
1595 SUBDBG("i: %d, pe_ctx->event_table->num_native_events: %d\n", i, pe_ctx->event_table->num_native_events);
1596
1597 /* Move this events hardware config values and other attributes to the perf_events attribute structure */
1598 memcpy (&pe_ctl->events[i].attr, &ntv_evt->attr, sizeof(perf_event_attr_t));
1599
1600 /* may need to update the attribute structure with information from event set level domain settings (values set by PAPI_set_domain) */
1601 /* only done if the event mask which controls each counting domain was not provided */
1602
1603 /* get pointer to allocated name, will be NULL when adding preset events to event set */
1604 char *aName = ntv_evt->allocated_name;
1605 if ((aName == NULL) || (strstr(aName, ":u=") == NULL)) {
1606 SUBDBG("set exclude_user attribute from eventset level domain flags, encode: %d, eventset: %d\n", pe_ctl->events[i].attr.exclude_user, !(pe_ctl->domain & PAPI_DOM_USER));
1607 pe_ctl->events[i].attr.exclude_user = !(pe_ctl->domain & PAPI_DOM_USER);
1608 }
1609 if ((aName == NULL) || (strstr(aName, ":k=") == NULL)) {
1610 SUBDBG("set exclude_kernel attribute from eventset level domain flags, encode: %d, eventset: %d\n", pe_ctl->events[i].attr.exclude_kernel, !(pe_ctl->domain & PAPI_DOM_KERNEL));
1611 pe_ctl->events[i].attr.exclude_kernel = !(pe_ctl->domain & PAPI_DOM_KERNEL);
1612 }
1613
1614 // libpfm4 supports mh (monitor host) and mg (monitor guest) event masks
1615 // perf_events supports exclude_hv and exclude_idle attributes
1616 // PAPI_set_domain supports PAPI_DOM_SUPERVISOR and PAPI_DOM_OTHER domain attributes
1617 // not sure how these perf_event attributes, and PAPI domain attributes relate to each other
1618 // if that can be figured out then there should probably be code here to set some perf_events attributes based on what was set in a PAPI_set_domain call
1619 // the code sample below is one possibility
1620// if (strstr(ntv_evt->allocated_name, ":mg=") == NULL) {
1621// SUBDBG("set exclude_hv attribute from eventset level domain flags, encode: %d, eventset: %d\n", pe_ctl->events[i].attr.exclude_hv, !(pe_ctl->domain & PAPI_DOM_SUPERVISOR));
1622// pe_ctl->events[i].attr.exclude_hv = !(pe_ctl->domain & PAPI_DOM_SUPERVISOR);
1623// }
1624
1625
1626 // set the cpu number provided with an event mask if there was one (will be -1 if mask not provided)
1627 pe_ctl->events[i].cpu = ntv_evt->cpu;
1628 // if cpu event mask not provided, then set the cpu to use to what may have been set on call to PAPI_set_opt (will still be -1 if not called)
1629 if (pe_ctl->events[i].cpu == -1) {
1630 pe_ctl->events[i].cpu = pe_ctl->cpu;
1631 }
1632 } else {
1633 /* This case happens when called from _pe_set_overflow and _pe_ctl */
1634 /* Those callers put things directly into the pe_ctl structure so it is already set for the open call */
1635 }
1636
1637 /* Copy the inherit flag into the attribute block that will be passed to the kernel */
1638 pe_ctl->events[i].attr.inherit = pe_ctl->inherit;
1639
1640 /* Set the position in the native structure */
1641 /* We just set up events linearly */
1642 if ( native ) {
1643 native[i].ni_position = i;
1644 SUBDBG( "&native[%d]: %p, ni_papi_code: %#x, ni_event: %#x, ni_position: %d, ni_owners: %d\n",
1645 i, &(native[i]), native[i].ni_papi_code, native[i].ni_event, native[i].ni_position, native[i].ni_owners);
1646 }
1647 }
1648
1649 if (count <= skipped_events) {
1650 SUBDBG("EXIT: No events to count, they all contained invalid umasks\n");
1651 return PAPI_ENOEVNT;
1652 }
1653
1654 pe_ctl->num_events = count - skipped_events;
1655
1656 /* actually open the events */
1657 ret = open_pe_events( pe_ctx, pe_ctl );
1658 if ( ret != PAPI_OK ) {
1659 SUBDBG("EXIT: open_pe_events returned: %d\n", ret);
1660 /* Restore values ? */
1661 return ret;
1662 }
1663
1664 SUBDBG( "EXIT: PAPI_OK\n" );
1665 return PAPI_OK;
1666}
#define PAPI_DOM_USER
Definition: f90papi.h:174
#define PAPI_DOM_KERNEL
Definition: f90papi.h:254
int _papi_hwi_get_ntv_idx(unsigned int papi_evt_code)
static int native
static int close_pe_events(pe_context_t *ctx, pe_control_t *ctl)
Definition: perf_event.c:938
static int open_pe_events(pe_context_t *ctx, pe_control_t *ctl)
Definition: perf_event.c:693
perf_event_attr_t attr
struct native_event_t * native_events
Here is the call graph for this function:
Here is the caller graph for this function:

◆ _pe_write()

static int _pe_write ( hwd_context_t ctx,
hwd_control_state_t ctl,
long long from 
)
static

Definition at line 1092 of file perf_event.c.

1094{
1095 ( void ) ctx; /*unused */
1096 ( void ) ctl; /*unused */
1097 ( void ) from; /*unused */
1098 /*
1099 * Counters cannot be written. Do we need to virtualize the
1100 * counters so that they can be written, or perhaps modify code so that
1101 * they can be written? FIXME ?
1102 */
1103
1104 return PAPI_ENOSUPP;
1105}

◆ arm64_request_user_access()

static void arm64_request_user_access ( struct perf_event_attr hw_event)
inlinestatic

Definition at line 686 of file perf_event.c.

687{
688 hw_event->config1=0x2; /* Request user access */
689}
Here is the caller graph for this function:

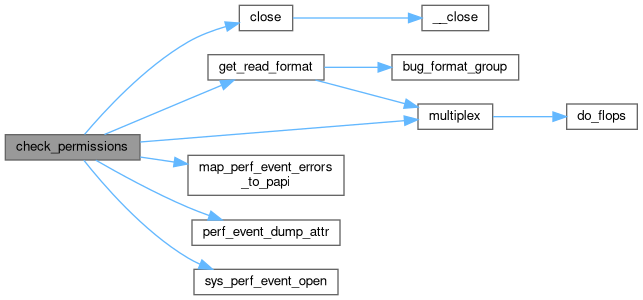
◆ bug_format_group()

static int bug_format_group ( void  )
static

Definition at line 181 of file perf_event.c.

181 {
182
183
184#if (OBSOLETE_WORKAROUNDS==1)
185 if (_papi_os_info.os_version < LINUX_VERSION(2,6,34)) return 1;
186#endif
187
188 /* MIPS, as of version 3.1, does not support this properly */
189 /* FIXME: is this still true? */
190
191#if defined(__mips__)
192 return 1;
193#endif
194
195 return 0;
196
197}
Here is the caller graph for this function:

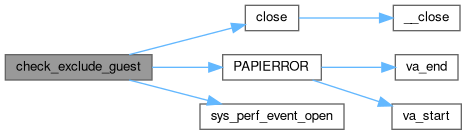
◆ check_exclude_guest()

void check_exclude_guest ( void  )

Definition at line 278 of file perf_event.c.

279{
280 int ev_fd;
281 struct perf_event_attr attr;
282
284
285 /* First check that we can open a plain instructions event */
286 memset(&attr, 0 , sizeof(attr));
287 attr.config = PERF_COUNT_HW_INSTRUCTIONS;
288
289 ev_fd = sys_perf_event_open( &attr, 0, -1, -1, 0 );
290 if ( ev_fd == -1 ) {
291 PAPIERROR("Couldn't open hw_instructions in exclude_guest=0 test");
292 return;
293 }
294 close(ev_fd);
295
296 /* Now try again with excude_guest */
297 memset(&attr, 0 , sizeof(attr));
298 attr.config = PERF_COUNT_HW_INSTRUCTIONS;
299 attr.exclude_guest=1;
300
301 ev_fd = sys_perf_event_open( &attr, 0, -1, -1, 0 );
302 if ( ev_fd == -1 ) {
303 if (errno==EINVAL) {
305 }
306 else {
307 PAPIERROR("Couldn't open hw_instructions in exclude_guest=1 test");
308 }
309 } else {
311 close(ev_fd);
312 }
313
314 return;
315}
static int exclude_guest_unsupported
Definition: perf_event.c:78
Here is the call graph for this function:
Here is the caller graph for this function:

◆ check_permissions()

static int check_permissions ( unsigned long  tid,
unsigned int  cpu_num,
unsigned int  domain,
unsigned int  granularity,
unsigned int  multiplex,
unsigned int  inherit 
)
static

Check if the current set of options is supported by

Definition at line 439 of file perf_event.c.

445{
446 int ev_fd;
447 struct perf_event_attr attr;
448
449 long pid;
450
451 /* clearing this will set a type of hardware and to count all domains */
452 memset(&attr, '\0', sizeof(attr));
453 attr.read_format = get_read_format(multiplex, inherit, 1);
454
455 /* set the event id (config field) to instructios */
456 /* (an event that should always exist) */
457 /* This was cycles but that is missing on Niagara */
458 attr.config = PERF_COUNT_HW_INSTRUCTIONS;
459
460 /* now set up domains this event set will be counting */
461 if (!(domain & PAPI_DOM_SUPERVISOR)) {
462 attr.exclude_hv = 1;
463 }
464 if (!(domain & PAPI_DOM_USER)) {
465 attr.exclude_user = 1;
466 }
467 if (!(domain & PAPI_DOM_KERNEL)) {
468 attr.exclude_kernel = 1;
469 }
470
471 if (granularity==PAPI_GRN_SYS) {
472 pid = -1;
473 } else {
474 pid = tid;
475 }
476
477 SUBDBG("Calling sys_perf_event_open() from check_permissions\n");
478
479 perf_event_dump_attr( &attr, pid, cpu_num, -1, 0 );
480
481 ev_fd = sys_perf_event_open( &attr, pid, cpu_num, -1, 0 );
482 if ( ev_fd == -1 ) {
483 SUBDBG("sys_perf_event_open returned error. Linux says, %s",
484 strerror( errno ) );
486 }
487
488 /* now close it, this was just to make sure we have permissions */
489 /* to set these options */
490 close(ev_fd);
491 return PAPI_OK;
492}
#define PAPI_DOM_SUPERVISOR
Definition: f90papi.h:109
int multiplex(void)
Definition: multiplex.c:35
i inherit inherit
static int map_perf_event_errors_to_papi(int perf_event_error)
Definition: perf_event.c:389
static unsigned int get_read_format(unsigned int multiplex, unsigned int inherit, int format_group)
Definition: perf_event.c:247
static int pid
Here is the call graph for this function:
Here is the caller graph for this function:

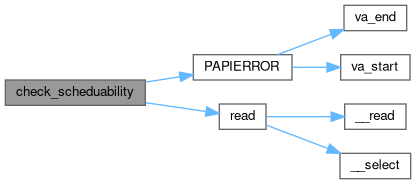
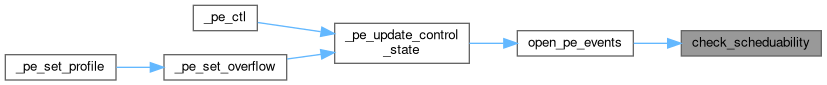
◆ check_scheduability()

static int check_scheduability ( pe_context_t ctx,
pe_control_t ctl,
int  idx 
)
static

Definition at line 510 of file perf_event.c.
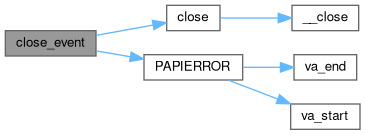
511{
512 int retval = 0, cnt = -1;
513 ( void ) ctx; /*unused */
514 long long papi_pe_buffer[READ_BUFFER_SIZE];
515 int i,group_leader_fd;
516
517 /* If the kernel isn't tracking scheduability right */
518 /* Then we need to start/stop/read to force the event */
519 /* to be scheduled and see if an error condition happens. */
520
521 /* get the proper fd to start */
522 group_leader_fd=ctl->events[idx].group_leader_fd;
523 if (group_leader_fd==-1) group_leader_fd=ctl->events[idx].event_fd;
524
525 /* start the event */
526 retval = ioctl( group_leader_fd, PERF_EVENT_IOC_ENABLE, NULL );
527 if (retval == -1) {
528 PAPIERROR("ioctl(PERF_EVENT_IOC_ENABLE) failed");
529 return PAPI_ESYS;
530 }
531
532 /* stop the event */
533 retval = ioctl(group_leader_fd, PERF_EVENT_IOC_DISABLE, NULL );
534 if (retval == -1) {
535 PAPIERROR( "ioctl(PERF_EVENT_IOC_DISABLE) failed" );
536 return PAPI_ESYS;
537 }
538
539 /* See if a read returns any results */
540 cnt = read( group_leader_fd, papi_pe_buffer, sizeof(papi_pe_buffer));
541 if ( cnt == -1 ) {
542 SUBDBG( "read returned an error! Should never happen.\n" );
543 return PAPI_ESYS;
544 }
545
546 if ( cnt == 0 ) {
547 /* We read 0 bytes if we could not schedule the event */
548 /* The kernel should have detected this at open */
549 /* but various bugs (including NMI watchdog) */
550 /* result in this behavior */
551
552 return PAPI_ECNFLCT;
553
554 } else {
555
556 /* Reset all of the counters (opened so far) back to zero */
557 /* from the above brief enable/disable call pair. */
558
559 /* We have to reset all events because reset of group leader */
560 /* does not reset all. */
561 /* we assume that the events are being added one by one and that */
562 /* we do not need to reset higher events (doing so may reset ones */
563 /* that have not been initialized yet. */
564
565 /* Note... PERF_EVENT_IOC_RESET does not reset time running */
566 /* info if multiplexing, so we should avoid coming here if */
567 /* we are multiplexing the event. */
568 for( i = 0; i < idx; i++) {
569 retval=ioctl( ctl->events[i].event_fd, PERF_EVENT_IOC_RESET, NULL );
570 if (retval == -1) {
571 PAPIERROR( "ioctl(PERF_EVENT_IOC_RESET) #%d/%d %d "
572 "(fd %d)failed",
573 i,ctl->num_events,idx,ctl->events[i].event_fd);
574 return PAPI_ESYS;
575 }
576 }
577 }
578 return PAPI_OK;
579}
#define PAPI_ECNFLCT
Definition: f90papi.h:234
Here is the call graph for this function:
Here is the caller graph for this function:

◆ close_event()

static int close_event ( pe_event_info_t event)
static

Definition at line 904 of file perf_event.c.
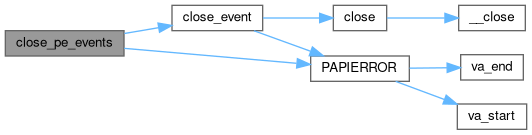
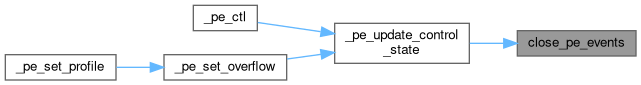
905{
906 int munmap_error=0,close_error=0;
907
908 if ( event->mmap_buf ) {
909 if (event->nr_mmap_pages==0) {
910 PAPIERROR("munmap and num pages is zero");
911 }
912 if ( munmap ( event->mmap_buf,
913 event->nr_mmap_pages * getpagesize() ) ) {
914 PAPIERROR( "munmap of fd = %d returned error: %s",
915 event->event_fd,
916 strerror( errno ) );
917 event->mmap_buf=NULL;
918 munmap_error=1;
919 }
920 }
921 if ( close( event->event_fd ) ) {
922 PAPIERROR( "close of fd = %d returned error: %s",
923 event->event_fd, strerror( errno ) );
924 close_error=1;
925 }
926
927 event->event_opened=0;
928
929 if ((close_error || munmap_error)) {
930 return PAPI_ESYS;
931 }
932
933 return 0;
934}
uint32_t nr_mmap_pages
Here is the call graph for this function:
Here is the caller graph for this function:

◆ close_pe_events()

static int close_pe_events ( pe_context_t ctx,
pe_control_t ctl 
)
static

Definition at line 938 of file perf_event.c.

939{
940 int i,result;
941 int num_closed=0;
942 int events_not_opened=0;
943
944 /* should this be a more serious error? */
945 if ( ctx->state & PERF_EVENTS_RUNNING ) {
946 SUBDBG("Closing without stopping first\n");
947 }
948
949 /* Close child events first */
950 /* Is that necessary? -- vmw */
951 for( i=0; i<ctl->num_events; i++ ) {
952 if (ctl->events[i].event_opened) {
953 if (ctl->events[i].group_leader_fd!=-1) {
954 result=close_event(&ctl->events[i]);
955 if (result!=0) return result;
956 else num_closed++;
957 }
958 }
959 else {
960 events_not_opened++;
961 }
962 }
963
964 /* Close the group leaders last */
965 for( i=0; i<ctl->num_events; i++ ) {
966 if (ctl->events[i].event_opened) {
967 if (ctl->events[i].group_leader_fd==-1) {
968 result=close_event(&ctl->events[i]);
969 if (result!=0) return result;
970 else num_closed++;
971 }
972 }
973 }
974
975 if (ctl->num_events!=num_closed) {
976 if (ctl->num_events!=(num_closed+events_not_opened)) {
977 PAPIERROR("Didn't close all events: "
978 "Closed %d Not Opened: %d Expected %d",
979 num_closed,events_not_opened,ctl->num_events);
980 return PAPI_EBUG;
981 }
982 }
983
984 ctl->num_events=0;
985
986 ctx->state &= ~PERF_EVENTS_OPENED;
987
988 return PAPI_OK;
989}
static int close_event(pe_event_info_t *event)
Definition: perf_event.c:904
Here is the call graph for this function:
Here is the caller graph for this function:

◆ configure_fd_for_sampling()

static int configure_fd_for_sampling ( pe_control_t ctl,
int  evt_idx 
)
static

Definition at line 585 of file perf_event.c.
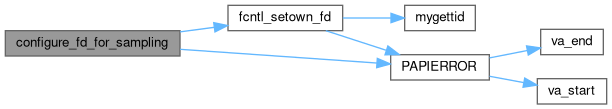
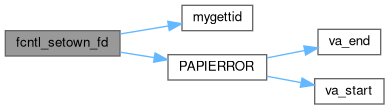
586{
587 int ret;
588 int fd = ctl->events[evt_idx].event_fd;
589
590 /* Register that we would like a SIGIO notification when a mmap'd page */
591 /* becomes full. */
592 ret = fcntl( fd, F_SETFL, O_ASYNC | O_NONBLOCK );
593 if ( ret ) {
594 PAPIERROR ( "fcntl(%d, F_SETFL, O_ASYNC | O_NONBLOCK) "
595 "returned error: %s", fd, strerror( errno ) );
596 return PAPI_ESYS;
597 }
598
599 /* Set the F_SETOWN_EX flag on the fd. */
600 /* This affects which thread an overflow signal gets sent to. */
601 ret=fcntl_setown_fd(fd);
602 if (ret!=PAPI_OK) return ret;
603
604 /* Set FD_CLOEXEC. Otherwise if we do an exec with an overflow */
605 /* running, the overflow handler will continue into the exec()'d*/
606 /* process and kill it because no signal handler is set up. */
607 ret=fcntl(fd, F_SETFD, FD_CLOEXEC);
608 if (ret) {
609 return PAPI_ESYS;
610 }
611
612 /* when you explicitely declare that you want a particular signal, */
613 /* even with you use the default signal, the kernel will send more */
614 /* information concerning the event to the signal handler. */
615 /* */
616 /* In particular, it will send the file descriptor from which the */
617 /* event is originating which can be quite useful when monitoring */
618 /* multiple tasks from a single thread. */
619 ret = fcntl( fd, F_SETSIG, ctl->overflow_signal );
620 if ( ret == -1 ) {
621 PAPIERROR( "cannot fcntl(F_SETSIG,%d) on %d: %s",
622 ctl->overflow_signal, fd,
623 strerror( errno ) );
624 return PAPI_ESYS;
625 }
626
627 return PAPI_OK;
628}
static int fcntl_setown_fd(int fd)
Definition: perf_event.c:222
Here is the call graph for this function:
Here is the caller graph for this function:

◆ fcntl_setown_fd()

static int fcntl_setown_fd ( int  fd)
static

Definition at line 222 of file perf_event.c.

222 {
223
224 int ret;
225 struct f_owner_ex fown_ex;
226
227 /* F_SETOWN_EX is not available until 2.6.32 */
228 /* but PAPI perf_event support didn't work on 2.6.31 anyay */
229
230 /* set ownership of the descriptor */
231 fown_ex.type = F_OWNER_TID;
232 fown_ex.pid = mygettid();
233 ret = fcntl(fd, F_SETOWN_EX, (unsigned long)&fown_ex );
234
235 if ( ret == -1 ) {
236 PAPIERROR( "cannot fcntl(F_SETOWN_EX) on %d: %s",
237 fd, strerror( errno ) );
238 return PAPI_ESYS;
239 }
240 return PAPI_OK;
241}
static pid_t mygettid(void)
Definition: darwin-common.h:11
#define F_OWNER_TID
Definition: linux-common.h:32
#define F_SETOWN_EX
Definition: linux-common.h:29
Here is the call graph for this function:
Here is the caller graph for this function:

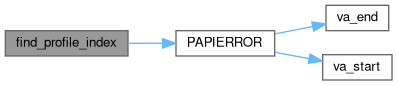
◆ find_profile_index()

static int find_profile_index ( EventSetInfo_t ESI,
int  evt_idx,
int flags,
unsigned int native_index,
int profile_index 
)
static

Definition at line 1917 of file perf_event.c.
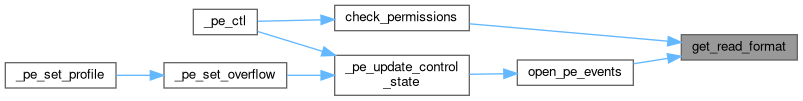
1919{
1920 int pos, esi_index, count;
1921
1922 for ( count = 0; count < ESI->profile.event_counter; count++ ) {
1923 esi_index = ESI->profile.EventIndex[count];
1924 pos = ESI->EventInfoArray[esi_index].pos[0];
1925
1926 if ( pos == evt_idx ) {
1927 *profile_index = count;
1928 *native_index = ESI->NativeInfoArray[pos].ni_event &
1930 *flags = ESI->profile.flags;
1931 SUBDBG( "Native event %d is at profile index %d, flags %d\n",
1932 *native_index, *profile_index, *flags );
1933 return PAPI_OK;
1934 }
1935 }
1936 PAPIERROR( "wrong count: %d vs. ESI->profile.event_counter %d",
1937 count, ESI->profile.event_counter );
1938 return PAPI_EBUG;
1939}
#define PAPI_NATIVE_AND_MASK
NativeInfo_t * NativeInfoArray
Here is the call graph for this function:
Here is the caller graph for this function:

◆ get_read_format()

static unsigned int get_read_format ( unsigned int  multiplex,
unsigned int  inherit,
int  format_group 
)
static

Definition at line 247 of file perf_event.c.

250{
251 unsigned int format = 0;
252
253 /* if we need read format options for multiplexing, add them now */
254 if (multiplex) {
255 format |= PERF_FORMAT_TOTAL_TIME_ENABLED;
256 format |= PERF_FORMAT_TOTAL_TIME_RUNNING;
257 }
258
259 /* if our kernel supports it and we are not using inherit, */
260 /* add the group read options */
261 if ( (!bug_format_group()) && !inherit) {
262 if (format_group) {
263 format |= PERF_FORMAT_GROUP;
264 }
265 }
266
267 SUBDBG("multiplex: %d, inherit: %d, group_leader: %d, format: %#x\n",
268 multiplex, inherit, format_group, format);
269
270 return format;
271}
Here is the call graph for this function:
Here is the caller graph for this function:

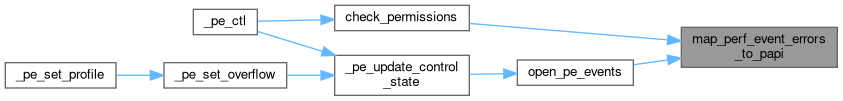
◆ map_perf_event_errors_to_papi()

static int map_perf_event_errors_to_papi ( int  perf_event_error)
static

Definition at line 389 of file perf_event.c.
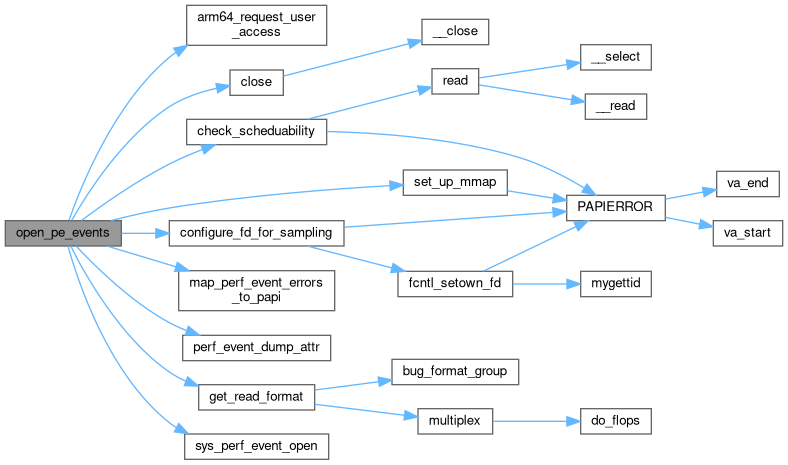
389 {
390
391 int ret;
392
393 /* These mappings are approximate.
394 EINVAL in particular can mean lots of different things */
395 switch(perf_event_error) {
396 case EPERM:
397 case EACCES:
398 ret = PAPI_EPERM;
399 break;
400 case ENODEV:
401 case EOPNOTSUPP:
402 ret = PAPI_ENOSUPP;
403 break;
404 case ENOENT:
405 ret = PAPI_ENOEVNT;
406 break;
407 case ESRCH: /* If cannnot find process to attach to */
408 case ENOSYS:
409 case EAGAIN:
410 case EBUSY:
411 case E2BIG: /* Only happens if attr is the wrong size somehow */
412 case EBADF: /* We are attempting to group with an invalid file descriptor */
413 ret = PAPI_ESYS;
414 break;
415 case ENOMEM:
416 ret = PAPI_ENOMEM;
417 break;
418 case EMFILE: /* Out of file descriptors. Typically max out at 1024 */
419 ret = PAPI_ECOUNT;
420 break;
421 case EINVAL:
422 default:
423 ret = PAPI_EINVAL;
424 break;
425 }
426 return ret;
427}
#define PAPI_EPERM
Definition: f90papi.h:112
Here is the caller graph for this function:

◆ open_pe_events()

static int open_pe_events ( pe_context_t ctx,
pe_control_t ctl 
)
static

Definition at line 693 of file perf_event.c.

694{
695
696 int i, ret = PAPI_OK;
697 long pid;
698
699
700 /* Set the pid setting */
701 /* If attached, this is the pid of process we are attached to. */
702 /* If GRN_THRD then it is 0 meaning current process only */
703 /* If GRN_SYS then it is -1 meaning all procs on this CPU */
704 /* Note if GRN_SYS then CPU must be specified, not -1 */
705
706 if (ctl->attached) {
707 pid = ctl->tid;
708 }
709 else {
710 if (ctl->granularity==PAPI_GRN_SYS) {
711 pid = -1;
712 }
713 else {
714 pid = 0;
715 }
716 }
717
718 for( i = 0; i < ctl->num_events; i++ ) {
719
720 ctl->events[i].event_opened=0;
721
722 /* set up the attr structure. */
723 /* We don't set up all fields here */
724 /* as some have already been set up previously. */
725
726 /* Handle the broken exclude_guest problem */
727 /* libpfm4 sets this by default (PEBS events depend on it) */
728 /* but on older kernels that dont know about exclude_guest */
729 /* perf_event_open() will error out as a "reserved" */
730 /* unknown bit is set to 1. */
731 /* Do we need to also watch for exclude_host, exclude_idle */
732 /* exclude_callchain*? */
733 if ((ctl->events[i].attr.exclude_guest) &&
735 SUBDBG("Disabling exclude_guest in event %d\n",i);
736 ctl->events[i].attr.exclude_guest=0;
737 }
738
739 /* group leader (event 0) is special */
740 /* If we're multiplexed, everyone is a group leader */
741 if (( i == 0 ) || (ctl->multiplexed)) {
742 ctl->events[i].attr.pinned = !ctl->multiplexed;
743 ctl->events[i].attr.disabled = 1;
744#if defined(__aarch64__)
747 }
748#endif
749 ctl->events[i].group_leader_fd=-1;
750 ctl->events[i].attr.read_format = get_read_format(
751 ctl->multiplexed,
752 ctl->inherit,
753 !ctl->multiplexed );
754 } else {
755 ctl->events[i].attr.pinned=0;
756 ctl->events[i].attr.disabled = 0;
757#if defined(__aarch64__)
760 }
761#endif
762 ctl->events[i].group_leader_fd=ctl->events[0].event_fd;
763 ctl->events[i].attr.read_format = get_read_format(
764 ctl->multiplexed,
765 ctl->inherit,
766 0 );
767 }
768
769 /* try to open */
771 &ctl->events[i].attr,
772 pid,
773 ctl->events[i].cpu,
775 0 /* flags */ );
776
778 &ctl->events[i].attr,
779 pid,
780 ctl->events[i].cpu,
782 0 /* flags */ );
783
784 /* Try to match Linux errors to PAPI errors */
785 if ( ctl->events[i].event_fd == -1 ) {
786 SUBDBG("sys_perf_event_open returned error "
787 "on event #%d. Error: %s\n",
788 i, strerror( errno ) );
790
791 goto open_pe_cleanup;
792 }
793
794 SUBDBG ("sys_perf_event_open: tid: %ld, cpu_num: %d,"
795 " group_leader/fd: %d, event_fd: %d,"
796 " read_format: %"PRIu64"\n",
797 pid, ctl->events[i].cpu,
799 ctl->events[i].event_fd,
800 ctl->events[i].attr.read_format);
801
802
803 /* in many situations the kernel will indicate we opened fine */
804 /* yet things will fail later. So we need to double check */
805 /* we actually can use the events we've set up. */
806
807 /* This is not necessary if we are multiplexing, and in fact */
808 /* we cannot do this properly if multiplexed because */
809 /* PERF_EVENT_IOC_RESET does not reset the time running info */
810 if (!ctl->multiplexed) {
811 ret = check_scheduability( ctx, ctl, i );
812
813 if ( ret != PAPI_OK ) {
814 /* the last event did open, so we need to */
815 /* bump the counter before doing the cleanup */
816 i++;
817 goto open_pe_cleanup;
818 }
819 }
820 ctl->events[i].event_opened=1;
821 }
822
823 /* Now that we've successfully opened all of the events, do whatever */
824 /* "tune-up" is needed to attach the mmap'd buffers, signal handlers, */
825 /* and so on. */
826
827
828 /* Make things easier and give each event a mmap() buffer */
829 /* Keeping separate tracking for rdpmc vs regular events */
830 /* Would be a pain. Also perf always gives every event a */
831 /* mmap buffer. */
832
833 for ( i = 0; i < ctl->num_events; i++ ) {
834
835 /* Can't mmap() inherited events :( */
836 if (ctl->inherit) {
837 ctl->events[i].nr_mmap_pages = 0;
838 ctl->events[i].mmap_buf = NULL;
839 }
840 else {
841 /* Just a guess at how many pages would make this */
842 /* relatively efficient. */
843 /* Note that it's "1 +" because of the need for a */
844 /* control page, and the number following the "+" */
845 /* must be a power of 2 (1, 4, 8, 16, etc) or zero. */
846 /* This is required to optimize dealing with */
847 /* circular buffer wrapping of the mapped pages. */
848 if (ctl->events[i].sampling) {
849 ctl->events[i].nr_mmap_pages = 1 + 2;
850 }
852 ctl->events[i].nr_mmap_pages = 1;
853 }
854 else {
855 ctl->events[i].nr_mmap_pages = 0;
856 }
857
858 /* Set up the MMAP sample pages */
859 if (ctl->events[i].nr_mmap_pages) {
860 set_up_mmap(ctl,i);
861 } else {
862 ctl->events[i].mmap_buf = NULL;
863 }
864 }
865 }
866
867 for ( i = 0; i < ctl->num_events; i++ ) {
868
869 /* If sampling is enabled, hook up signal handler */
870 if (ctl->events[i].attr.sample_period) {
871
872 ret = configure_fd_for_sampling( ctl, i );
873 if ( ret != PAPI_OK ) {
874 /* We failed, and all of the fds are open */
875 /* so we need to clean up all of them */
876 i = ctl->num_events;
877 goto open_pe_cleanup;
878 }
879 }
880 }
881
882 /* Set num_evts only if completely successful */
884
885 return PAPI_OK;
886
887open_pe_cleanup:
888 /* We encountered an error, close up the fds we successfully opened. */
889 /* We go backward in an attempt to close group leaders last, although */
890 /* That's probably not strictly necessary. */
891 while ( i > 0 ) {
892 i--;
893 if (ctl->events[i].event_fd>=0) {
894 close( ctl->events[i].event_fd );
895 ctl->events[i].event_opened=0;
896 }
897 }
898
899 return ret;
900}
static int configure_fd_for_sampling(pe_control_t *ctl, int evt_idx)
Definition: perf_event.c:585
#define PERF_EVENTS_OPENED
Definition: perf_event.c:64
static int check_scheduability(pe_context_t *ctx, pe_control_t *ctl, int idx)
Definition: perf_event.c:510
static int set_up_mmap(pe_control_t *ctl, int evt_idx)
Definition: perf_event.c:631
Here is the call graph for this function:
Here is the caller graph for this function:

◆ pe_vendor_fixups()

static int pe_vendor_fixups ( papi_vector_t vector)
static

Definition at line 117 of file perf_event.c.

118{
119 /* powerpc */
120 /* On IBM and Power6 Machines default domain should include supervisor */
122 vector->cmp_info.available_domains |=
124 if (strcmp(_papi_hwi_system_info.hw_info.model_string, "POWER6" ) == 0 ) {
125 vector->cmp_info.default_domain =
127 }
128 }
129
132 }
133
136 vector->cmp_info.fast_real_timer = 1;
137 }
138
139 /* ARM */
140 /* If implementer is ARM Limited. */
142
143 /* Some ARMv7 and earlier could not measure */
144 /* KERNEL and USER separately. */
145
146 /* Whitelist CortexA7 and CortexA15 */
147 /* There might be more */
148
152
153 vector->cmp_info.available_domains |=
155 vector->cmp_info.default_domain =
157 }
158 }
159
160 /* CRAY */
163 }
164
165 return PAPI_OK;
166}
#define PAPI_DOM_OTHER
Definition: f90papi.h:21
#define PAPI_VENDOR_IBM
Definition: f90papi.h:61
#define PAPI_VENDOR_CRAY
Definition: f90papi.h:211
#define PAPI_VENDOR_ARM_ARM
Definition: f90papi.h:102
#define PAPI_VENDOR_INTEL
Definition: f90papi.h:275
#define PAPI_VENDOR_AMD
Definition: f90papi.h:230
#define PAPI_VENDOR_MIPS
Definition: f90papi.h:74
papi_mdi_t _papi_hwi_system_info
Definition: papi_internal.c:56
unsigned int fast_real_timer
Definition: papi.h:656
int cpuid_family
Definition: papi.h:786
int cpuid_model
Definition: papi.h:787
int vendor
Definition: papi.h:781
char model_string[PAPI_MAX_STR_LEN]
Definition: papi.h:784
PAPI_hw_info_t hw_info
Here is the caller graph for this function:

◆ perf_event_dump_attr()

static void perf_event_dump_attr ( struct perf_event_attr hw_event,
pid_t  pid,
int  cpu,
int  group_fd,
unsigned long int  flags 
)
static

Definition at line 325 of file perf_event.c.

326 {
327
328 /* Mark parameters as not used */
329 /* In the common case (no SUBDBG) the function */
330 /* compiles into an empty function and complains */
331 /* about unused variables. */
332 (void)hw_event;
333 (void)pid;
334 (void)cpu;
335 (void)group_fd;
336 (void)flags;
337
338 SUBDBG("sys_perf_event_open(hw_event: %p, pid: %d, cpu: %d, "
339 "group_fd: %d, flags: %lx\n",
340 hw_event, pid, cpu, group_fd, flags);
341 SUBDBG(" type: %d\n",hw_event->type);
342 SUBDBG(" size: %d\n",hw_event->size);
343 SUBDBG(" config: %"PRIx64" (%"PRIu64")\n",
344 hw_event->config, hw_event->config);
345 SUBDBG(" sample_period: %"PRIu64"\n",hw_event->sample_period);
346 SUBDBG(" sample_type: %"PRIu64"\n",hw_event->sample_type);
347 SUBDBG(" read_format: %"PRIu64"\n",hw_event->read_format);
348 SUBDBG(" disabled: %d\n",hw_event->disabled);
349 SUBDBG(" inherit: %d\n",hw_event->inherit);
350 SUBDBG(" pinned: %d\n",hw_event->pinned);
351 SUBDBG(" exclusive: %d\n",hw_event->exclusive);
352 SUBDBG(" exclude_user: %d\n",hw_event->exclude_user);
353 SUBDBG(" exclude_kernel: %d\n",hw_event->exclude_kernel);
354 SUBDBG(" exclude_hv: %d\n",hw_event->exclude_hv);
355 SUBDBG(" exclude_idle: %d\n",hw_event->exclude_idle);
356 SUBDBG(" mmap: %d\n",hw_event->mmap);
357 SUBDBG(" comm: %d\n",hw_event->comm);
358 SUBDBG(" freq: %d\n",hw_event->freq);
359 SUBDBG(" inherit_stat: %d\n",hw_event->inherit_stat);
360 SUBDBG(" enable_on_exec: %d\n",hw_event->enable_on_exec);
361 SUBDBG(" task: %d\n",hw_event->task);
362 SUBDBG(" watermark: %d\n",hw_event->watermark);
363 SUBDBG(" precise_ip: %d\n",hw_event->precise_ip);
364 SUBDBG(" mmap_data: %d\n",hw_event->mmap_data);
365 SUBDBG(" sample_id_all: %d\n",hw_event->sample_id_all);
366 SUBDBG(" exclude_host: %d\n",hw_event->exclude_host);
367 SUBDBG(" exclude_guest: %d\n",hw_event->exclude_guest);
368 SUBDBG(" exclude_callchain_kernel: %d\n",
369 hw_event->exclude_callchain_kernel);
370 SUBDBG(" exclude_callchain_user: %d\n",
371 hw_event->exclude_callchain_user);
372 SUBDBG(" wakeup_events: %"PRIx32" (%"PRIu32")\n",
373 hw_event->wakeup_events, hw_event->wakeup_events);
374 SUBDBG(" bp_type: %"PRIx32" (%"PRIu32")\n",
375 hw_event->bp_type, hw_event->bp_type);
376 SUBDBG(" config1: %"PRIx64" (%"PRIu64")\n",
377 hw_event->config1, hw_event->config1);
378 SUBDBG(" config2: %"PRIx64" (%"PRIu64")\n",
379 hw_event->config2, hw_event->config2);
380 SUBDBG(" branch_sample_type: %"PRIx64" (%"PRIu64")\n",
381 hw_event->branch_sample_type, hw_event->branch_sample_type);
382 SUBDBG(" sample_regs_user: %"PRIx64" (%"PRIu64")\n",
383 hw_event->sample_regs_user, hw_event->sample_regs_user);
384 SUBDBG(" sample_stack_user: %"PRIx32" (%"PRIu32")\n",
385 hw_event->sample_stack_user, hw_event->sample_stack_user);
386}
Here is the caller graph for this function:

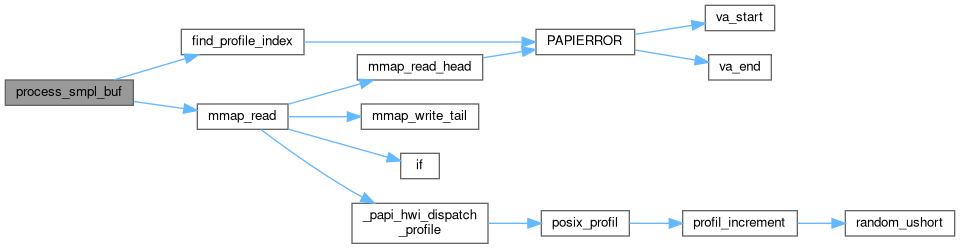
◆ process_smpl_buf()

static int process_smpl_buf ( int  evt_idx,
ThreadInfo_t **  thr,
int  cidx 
)
static

Definition at line 1944 of file perf_event.c.
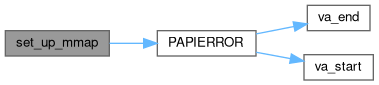
1945{
1946 int ret, flags, profile_index;
1947 unsigned native_index;
1948 pe_control_t *ctl;
1949
1950 ret = find_profile_index( ( *thr )->running_eventset[cidx], evt_idx,
1951 &flags, &native_index, &profile_index );
1952 if ( ret != PAPI_OK ) {
1953 return ret;
1954 }
1955
1956 ctl= (*thr)->running_eventset[cidx]->ctl_state;
1957
1958 mmap_read( cidx, thr, &(ctl->events[evt_idx]), profile_index );
1959
1960 return PAPI_OK;
1961}
static int find_profile_index(EventSetInfo_t *ESI, int evt_idx, int *flags, unsigned int *native_index, int *profile_index)
Definition: perf_event.c:1917
static void mmap_read(int cidx, ThreadInfo_t **thr, pe_event_info_t *pe, int profile_index)
Definition: perf_helpers.h:465
Here is the call graph for this function:
Here is the caller graph for this function:

◆ set_up_mmap()

static int set_up_mmap ( pe_control_t ctl,
int  evt_idx 
)
static

Definition at line 631 of file perf_event.c.

632{
633
634 void *buf_addr;
635 int fd = ctl->events[evt_idx].event_fd;
636
637 /* mmap() the sample buffer */
638 buf_addr = mmap( NULL,
639 ctl->events[evt_idx].nr_mmap_pages * getpagesize(),
640 PROT_READ | PROT_WRITE,
641 MAP_SHARED,
642 fd, 0 );
643
644 /* This may happen if we go over the limit in */
645 /* /proc/sys/kernel/perf_event_mlock_kb */
646 /* which defaults to 516k */
647 /* with regular rdpmc events on 4k page archs */
648 /* this is roughly 128 events */
649
650 /* We sholdn't fail, just fall back to non-rdpmc */
651 /* Although not sure what happens if it's a sample */
652 /* event that fails to mmap. */
653
654 if ( buf_addr == MAP_FAILED ) {
655 SUBDBG( "mmap(NULL,%d,%d,%d,%d,0): %s",
656 ctl->events[evt_idx].nr_mmap_pages * getpagesize(),
657 PROT_READ | PROT_WRITE,
658 MAP_SHARED,
659 fd, strerror( errno ) );
660
661 ctl->events[evt_idx].mmap_buf = NULL;
662
663 /* Easier to just globally disable this, as it should */
664 /* be a fairly uncommon case hopefully. */
666 PAPIERROR("Can't mmap, disabling fast_counter_read\n");
668 }
669 return PAPI_ESYS;
670 }
671
672 SUBDBG( "Sample buffer for fd %d is located at %p\n", fd, buf_addr );
673
674 /* Set up the mmap buffer and its associated helpers */
675 ctl->events[evt_idx].mmap_buf = (struct perf_counter_mmap_page *) buf_addr;
676 ctl->events[evt_idx].tail = 0;
677 ctl->events[evt_idx].mask =
678 ( ctl->events[evt_idx].nr_mmap_pages - 1 ) * getpagesize() - 1;
679
680 return PAPI_OK;
681}
Here is the call graph for this function:
Here is the caller graph for this function:

Variable Documentation

◆ _perf_event_vector

papi_vector_t _perf_event_vector

Definition at line 73 of file perf_event.c.

◆ exclude_guest_unsupported

int exclude_guest_unsupported
static

Definition at line 78 of file perf_event.c.

◆ our_cidx

int our_cidx
static

Definition at line 77 of file perf_event.c.

◆ perf_native_event_table

struct native_event_table_t perf_native_event_table

Definition at line 76 of file perf_event.c.