The damage configuration posed a number of potential problems that had to be addressed. The obvious question is whether or not this damage might allow a local structural burn-through and, if so, what the impacts would be. Additionally, since a portion of the insulating tile was removed, the bond line may overheat. This could allow the entire tile to be lost. Finally, increased local heating might cause excessive stress in the underlying aluminum skin due to thermal expansion.
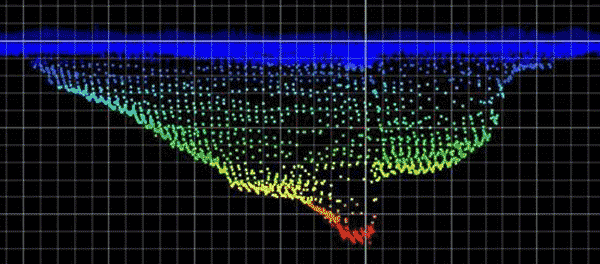
Because of the potential severity of the damage, additional data were requested to help better characterize the damage. A detailed, three-dimensional scan of the damage was performed once the Orbiter was docked with the Space Station using Laser Doppler Range Imaging hardware. The data were downlinked to the damage assessment team in the form of a “point cloud” as shown in Figure 3.

These data revealed that the cavity geometry was rather unique, and can be thought of as a cavity within a cavity. The deepest portion of the cavity extends to the insulation material between the two adjacent tiles. The neighboring tile is gouged roughly to the densified, lower portion of the tile. This configuration is fairly complex from an analysis point of view, and was somewhat out-of-family with the damages that had been used during experimental testing to develop a rapid-assessment, cavity-heating model. Consequently, the Orbiter Aerothermal CFD Team was asked to analyze the configuration to help provide the most accurate environment possible.
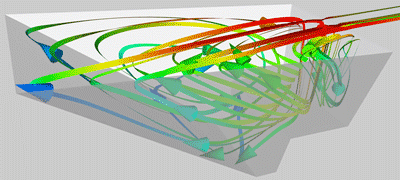
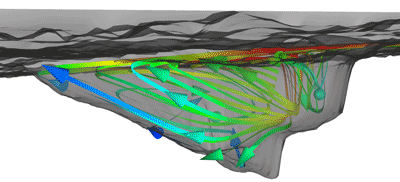
Due to initial uncertainty in the damage configuration, the analysis leads (at Johnson Space Center) requested that the analysis team (at Ames and Langley Research Centers) perform analysis on two different geometric configurations. Each configuration was analyzed at five different times along the predicted reentry trajectory. One of these configurations is shown on the left in Figure 4. The flow is from left to right, and the streamlines within the cavity are colored by temperature. The simulations showed that the majority of the high-energy flow bypassed the cavity altogether. Additionally, the critical exposed bond material was largely protected from the flow. The same set of streamlines is overlaid upon the scanned geometry and shown for reference in the right portion of the figure. The geometric similarity between the analyzed configuration and the true flight configuration is remarkable, and a unique capability offered by our urgent computing process put in place.


