
March 2008
|
Cyberinfrastructure for Coastal Hazard Prediction
|
 March 2008 |
Around half the U.S. population live in coastal areas, at risk from a range of coastal hazards including hurricane winds and storm surge, floods, tornados, tsunamis and rising sea-level. While changes in sea-level occur over time scales measured in decades or more, other hazards such as hurricanes or tornados occur on timescales of days or hours, and early accurate predictions of their effects are crucial for planning and emergency response.
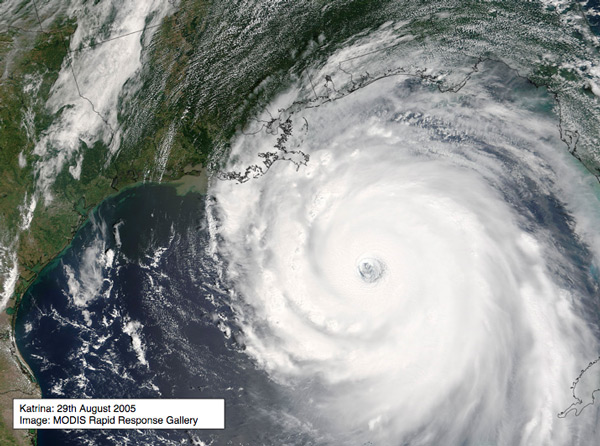
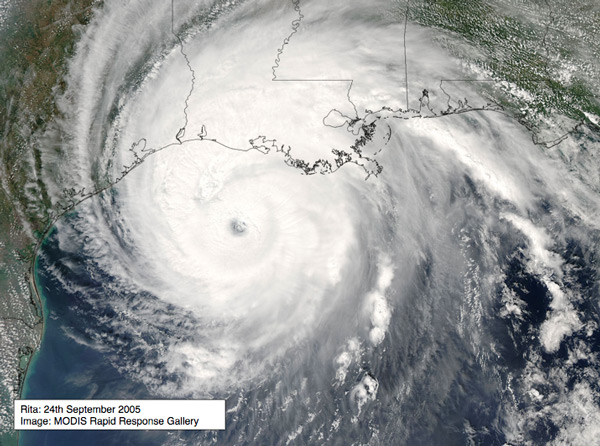
On the 29th August 2005, Hurricane Katrina (Fig. 1) hit New Orleans, with storm surge and flooding resulting in a tragic loss of life and destruction of property and infrastructure (Table 1). Soon after, Hurricane Rita caused similar devastation in the much less populated area of southwest Louisiana, and once again parts of New Orleans were under water. In both cases mandatory evacuations were enforced only 19 hours before the hurricanes made landfall. Speedier and more accurate analysis from prediction models could allow decision makers to evacuate earlier and with more preparation — and such hurricane prediction infrastructure is one goal of the SURA SCOOP Project.
The SCOOP Program1 2 is creating an open integrated network of distributed sensors, data and computer models to provide a broad array of services for applications and research involving coastal environmental prediction. At the heart of the program is a service-oriented cyberinfrastructure, which is being developed by modularizing critical components, providing standard interfaces and data descriptions, and leveraging new Grid technologies and approaches for dynamic data driven application systems3. This cyberinfrastructure includes components for data archiving, integration, translation and transport, model coupling and workflow, event notification and resource brokering.
| Hurricane Katrina | Hurricane Rita |
| Date: 23-30 Aug, 2005 | Date: 18-26 Sep, 2005 |
| Category 3 landfall (peak winds: 145 mph) on 29th Aug, 6:10 am CDT, near Buras LA. | Category 3 landfall (peak winds: 120 mph) on 24th Sep, 2:40 am CDT, Texas Louisiana Border. |
| Voluntary evacuation New Orleans: 37 hours before landfall. Mandatory evacuation: 19 hours before landfall. | Mandatory evacuation Galveston: 19 hours before landfall. |
| Human casualties: 1836 approx. Property damage: 120 billion, New Orleans population reduced by 50%. | Property damage: 35 billion, 10% population displaced from Houston and Galveston. |
| Storm size (width) at landfall: 460 miles Radius of hurricane force winds at landfall: 125 miles. Coastal storm surge: 18-22 feet. |
Storm size (width) at landfall: 410 miles Radius of hurricane force winds at landfall: 85 miles. Coastal storm surge: 15-20 feet. |
| Third most powerful hurricane to hit U.S coast. Most expensive. One of five deadliest. |
The SCOOP community currently engages in distributed coastal modeling across the southeastern US, including both the Atlantic and Gulf of Mexico coasts. Various coastal hydrodynamic models are run on both an on-demand and operational (24/7/365) basis to study physical phenomena such as wave dynamics, storm surge and current flow. The computational models, include4 Wave Watch 3 (WW3), Wave Model (WAM), Simulating Waves Nearshore (SWAN), ADvanced CIRCulation (ADCIRC) model, ElCIRC, and CH3D. In the on-demand scenario, advisories from the National Hurricane Center (NHC) detailing impending tropical storms or hurricanes trigger automated workflows consisting of appropriate hydrodynamical models. The resulting data fields are analyzed and results are published on a community portal, and are also distributed to the SCOOP partners for local visualization and further analysis, as well as being archived for further use in a highly available archive 5.
This article describes the technologies and procedures used for on-demand ensemble workflows that are used for predicting hurricane impacts, including urgent and prioritized workflows, local policies for compute resources, and providing access to urgent compute resources.
Hurricanes develop in warm ocean waters as an area of low pressure, which turns into a tropical storm as the circular wind motion becomes organized. As the wind speed picks up and crosses 74 mph, the storm is classified as a Category 1 Hurricane. Hurricanes typically take around 3-5 days to develop. Coastal modelers begin running models and providing projected hurricane tracks as soon as there is indication that an area of low pressure will turn into a storm. The National Hurricane Center (NHC) consolidates these various model runs and publishes a predicted storm track based on experience and historical data. These model predications are also coupled with data from real observations, such as the data provided by the hurricane hunter aircraft, and the published track is revised. Models are run every few hours with new information about position, central pressure, wind speeds etc. and the tracks are updated. This updated data is released to the community via advisories. The NHC publishes an advisory every six hours for every area of interest. The track data is picked up as soon as it is available and coastal scientists use this to run other wave, surge and inundation models.
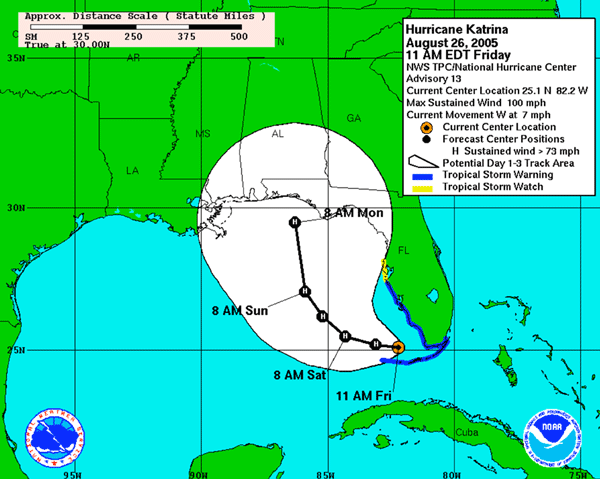
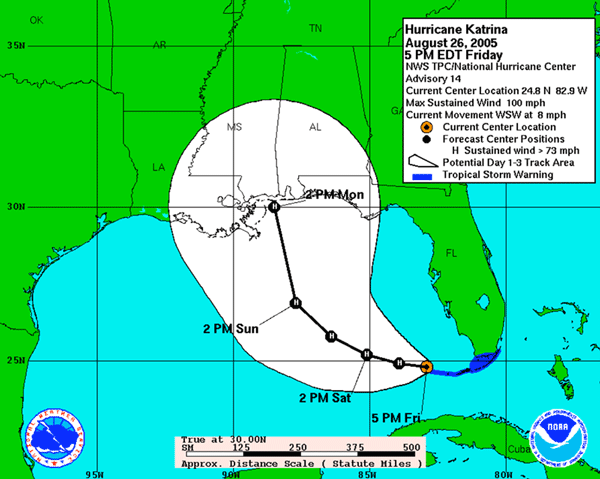
Since the NHC issues an advisory every six hours during a storm event, modelers have a six hour window in which to generate all the results based on the previous advisory and use the results to “hot start” the next runs with data from the next advisory. Figure 2 shows the tracks for the 13th and 14th advisories issued by NHC at 11AM EDT and 5PM EDT, respectively, on August 26, 2005 during Hurricane Katrina. The images highlight that there can be considerable difference in projected paths between advisories. It is believed that the necessary lead time for evacuation is 72 hours and accurate predications about the impact of the storm are dependent on the accuracy of the storm track. Hence the only way to overcome the inaccuracy in track prediction in order to provide reasonable guarantees of the predictions is to use ensemble modeling.
The development of low pressure areas and the timelines of these turning into hurricanes can vary from a few hours to a few days. A worst case scenario could have an advance notice of less than 12 hours, making it difficult to quickly obtain resources for an extensive set of investigatory model runs and also making it imperative to be able to rapidly deploy models and analysis data.
One obvious solution would be to dedicate a set of supercomputers for hurricane prediction. This would however require a significant investment to deploy and maintain the resources in a state of readiness; multiple sites would be needed to provide reliability, and the extent of the modeling would be restricted by the size of the machines.
A different solution is to use resources that are deployed and maintained to support other scientific activities, for example the NSF TeraGrid (which will soon be capable of providing over 1 PetaFlops of power), the SURAgrid (developing a community of resources providers to support research in the southeast US), or the Louisiana Optical Network Initiative (LONI) (with around 100 TeraFlops for state researchers in Louisiana). Section 3 describes some of the issues involved when resources are provided to both a broad community of scientists and to support urgent computing.
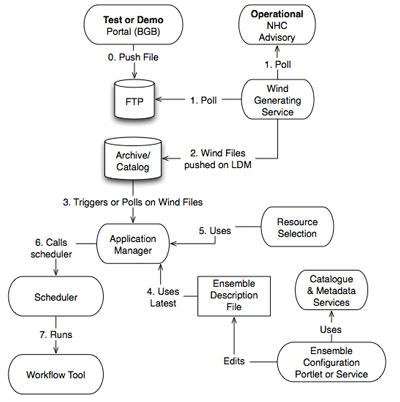
The impact of a hurricane is estimated from predicted storm surge height, wave height, inundation and other data. Coastal scientists provide estimations using a probabilistic ensemble of deterministic models to compute the probability distribution of plausible storm impacts. This distribution is then used to obtain a metric of relevance for the local emergency responders (e.g., the maximum water elevation or MEOW) and get to them in time to make an informed decision2. Thus, for every cycle there will be an ensemble of runs corresponding to the runs of all the models for each of the set of perturbed tracks. The SCOOP Cyberinfrastructure includes a workflow component to run each of the models for each of the tracks. The NHC advisory triggers the workflow that runs models to generate various products that are either input to other stages of the workflow or are final results that end up as visualized products. Figure 3 shows the SCOOP workflow from start to end and the interactions between various components.
During a storm event, the SCOOP workflow is initiated by an NHC advisory that becomes available on an FTP site that is continuously polled for new data. When new track data is detected, the wind field data is generated that is then pushed to the SCOOP archives using the Logical Data Manager (LDM) to handle data movement. Once the files are received at the archive, the archive identifies the file type and runs a trigger that triggers the execution of the wave and surge models. The trigger invokes the SCOOP Application Manager (SAM) that looks up the Ensemble Description File (EDF) to identify the urgency and priority associated with the run. The urgency and priority of a run and how the SCOOP system uses this information are elaborated in the next section.
The SCOOP infrastructure has been designed to support the urgent and dynamic deployment of ensembles of coastal models, where different members of the ensemble can have different urgency levels and different priority levels. Here we describe some of these new capabilities:
During a hurricane event, different coastal hydrodynamics models are executed to predict quantities such as wave height and storm surge. The input to the ensemble of models is wind field data obtained from various sources including analytic models and fully 3D computational models.
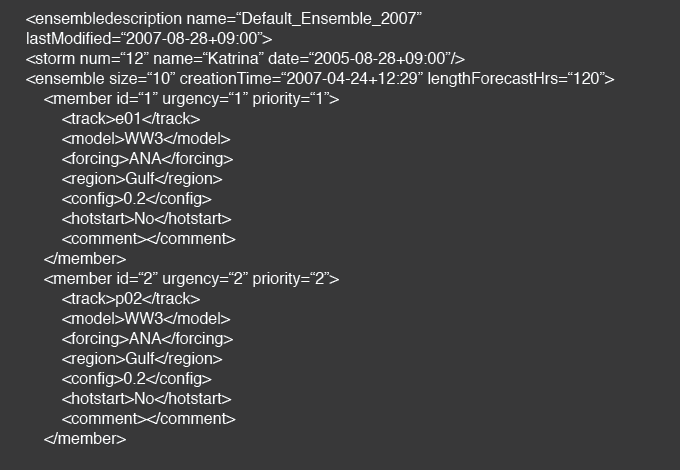
The SCOOP Application Manager (SAM) allows ensembles to be created either from template configurations for a particular region or scenario, by customized user input through the SCOOP portal, or by future dynamically created ensembles built using storm and region properties. The SAM configures ensembles using parameters for each ensemble member which set: (i) the model to be run; (ii) the track used to calculate forcing wind fields; (iii) the level of urgency; (iv) and the priority compared to other runs.
The urgency parameter specifies the immediateness of the job to be performed and can be set to one of the keywords red, orange or green. An urgency level of red indicates that the job should run immediately, if necessary by preempting other jobs running on a resource. An urgency of orange indicates the job should run in high priority mode, for example as next to run on a batch queue. Urgency levels of green are used for “normal” jobs, which do not have special access to resources. A second integer-valued parameter for priority specifies the order in which jobs should be completed.
The ensemble configuration information is encoded into an XML file called the Ensemble Description File (Fig. 4). The EDF contains the science information about the ensemble member and does not contain any resource specific information.
The SCOOP Application Manager consists of multiple other components such as a resource broker that generates a list of resources and their capabilities such as access to on-demand queues, type of batch system, etc. The Application Manager then sends the list of available resources on which these ensemble members can be executed, which is used by the scheduler to dispatch the job to the resource.
The SCOOP Workflow system consists of two basic components: The SCOOP scheduler and the Workflow manager. The scheduler takes the track execution requests from SAM accompanied with resource availability information (ERDF). The track execution requests are generated by SAM using the information in the EDF files. These requests contain all the information the scheduler needs to generate, schedule, and execute ensemble track subworkflows. A sample track execution request is shown below in Figure 5.

The scheduler implements a multi-level priority queue with three levels of queuing: "on demand," "high priority," and "best effort." After the scheduler checks the urgency level and priority of each request, it places them in the correct queue in the correct order. The dispatcher selects the next request to be executed and creates a subworkflow (DAG) for each request. These subworkflows are then submitted to the workflow manager.
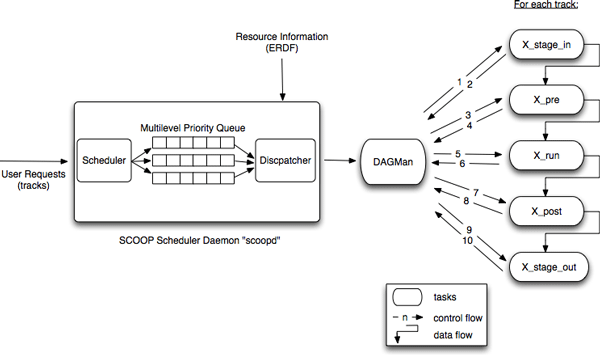
As the workflow manager, we are using an enhanced version of Condor DAGMan. This version of DAGMan enables us to visually monitor the execution of the ensemble tracks from a web-based graphical interface. The status of each sub-task of each track, as well as the execution time of each step can easily be monitored using this interface. DAGMan submits these workflows to the queues specified by the Application Manager using Condor-G. An illustration of the scheduler is shown in Figure 6.
The SCOOP scheduler queues are used mainly for internal prioritization and ordering, though the component also makes sure that the requests are mapped to the right kind of resources and queues. Once the jobs are dispatched, the quality of service received by the job is determined by the local resource policies and procedures, which are discussed in the next section.
The SCOOP system uses resources from various different grids such as the Louisiana Optical Network Initiative (LONI), SURAGrid and TeraGrid 6. All three grids have a very different mode of operation and administration. For instance the LONI grid is centrally administered and all policies are enforced on all resources. SURAGrid allows greater flexibility and control and policy making is in the hands of individual resource providers. The TeraGrid is also composed of resources that are administered by the resource providers. All three grids implement access to on-demand resources in a variety of ways. LONI machines make use of SPRUCE and preempt queues to offer on-demand resources. SURAGrid uses Loadleveler supported checkpoint restart mechanisms to provide access to on-demand resources by suspending running jobs. TeraGrid has an entire cluster dedicated for on-demand jobs. For SCOOP, so far we have primarily used the LONI and SURAGrid on-demand resources.
On the LONI machines, the processors are divided into two groups, AIX based and Linux based. The machines run their independent schedulers, and the processors on each resource are further subdivided into a preemptory pool and a dedicated pool. The preemptive queues feed the Preemptive pool of processors, and the dedicated queues feed the rest of the system. The checkpoint queues, which include all processors in both pools, can be used to submit system wide jobs. The job restart information should be saved periodically for the jobs in the checkpoint queue as they may be preempted when an urgent job arrives in the preempt queue. On the LONI systems, this is left for the user to do along with choosing an appropriate queue for submission. On the LONI AIX frames, the preempt queue is allowed a maximum of 48 processors. The rest of the available processors are in the dedicated queue called workq. Jobs in the checkpoint queue (checkpt) can run on the entire machine. Also the maximum allowed wall clock time for jobs is typically longer in the workq and shorter in the preempt queues. SURAGrid, as part of the resource agreement with resource providers, has access to 20% of the resource that some resources, such as Janus at GSU, offer as on-demand resources.
Using preemption or other mechanisms to enable urgent simulations on supercomputers is not new. However, the traditional procedure for implementing preemption is to run such jobs in a special queue for which access is only granted for a fixed set of users. The policy, queue configuration, and set of users on each machine, and particularly at each site, would need to be carefully negotiated (and usually frequently renegotiated). These procedures are usually not documented, thus it is difficult and time consuming to add new users for urgent computing, or to change the configuration of machines, for example to accommodate larger simulations. To resolve some of these issues, Special PRiority and Urgent Computing Environment (SPRUCE) 7 was implemented in the workflow. SPRUCE is a specialized software system to support urgent or event-driven computing on both traditional supercomputers and distributed Grids. It is being developed by the University of Chicago and Argonne National Laboratory and is presently functioning as a TeraGrid science gateway.
SPRUCE uses token based authentication system for resource allocation. Users are provided with right of way tokens, which are unique 16 character strings that can be activated through a web portal. The token is created on the CN value of the administrator. When a token is activated, there are other parameters that are set including:
The SCOOP on-demand system was demonstrated at the SuperComputing 2007 conference in Reno, Nevada using the resources of the SURAgrid and Louisiana Optical Network Initiative (LONI). The demo illustrated how a hurricane event triggered the use of on-demand resources, and how the priority-aware scheduler was able to schedule the runs on the appropriate queues in the appropriate order. The guarantee that a member runs as soon as data for it has been generated makes it possible to provide a guarantee that the set of runs chosen as high priority runs will complete before the six hour deadline. Other work in benchmarking the models on different architecture platforms was used to estimate the amount of CPU time that a model would need to complete given the number of on-demand processors available.
SPRUCE was used to acquire the on-demand processors on some resources, and highlighted several different advantages. For example, the SCOOP workflow was no longer tied to being run as certain special users. This also meant that there was no need for negotiating access to the on-demand queues with the resource owners. Also using SPRUCE provided the resource owners the ability to restrict the usage of the system in on-demand mode at the same time providing on-demand resources to any one who needs them. In the past this could only be done by adding and deleting user access on a case-by-case basis. SPRUCE tokens can now be handed out to users by an allocation committee, thus removing the burden of evaluating the need for on-demand resources by users from the system administrators.
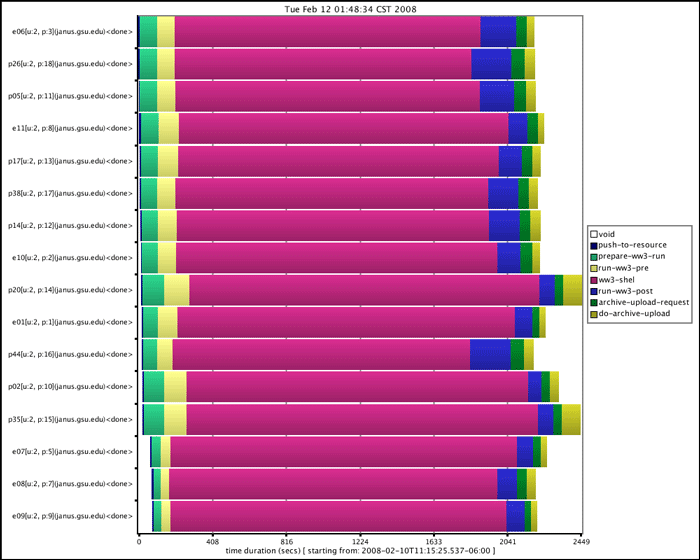
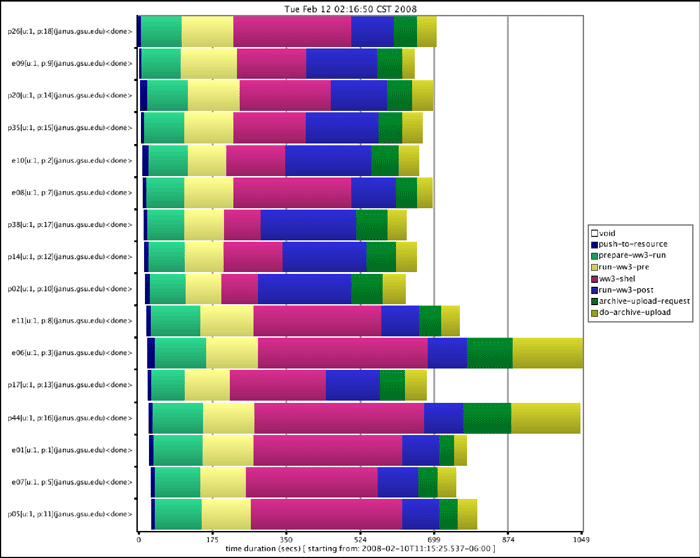
Figures 7(a) and 7(b) show the execution and wait times for the various stages of execution of the SCOOP workflow. Figure 7(a) shows the execution with only best-effort resources. The pink bars depict the execution and queue wait times of the core Wave Watch III execution on eight processors. It can be seen that the queue wait times account for most of the total time. Figure 7(b) depicts the ensemble execution using on-demand resources. In this case, 16 processors were available for on-demand use, hence two ensemble members ran simultaneously while others waited for these to finish.
A closer look at the 7(b) graph indicates that ensemble members p38 and p02 executed first followed by p14 and e10. The lengths of the pink bars for p14 and e10 are double that of p38 and p02 showing that they began execution right after the first two members finished execution. Comparing the two graphs, the last run finished in about 700 seconds when using on-demand resources compared to a time of about 2100 seconds without on-demand resources. It must be noted that the tests were performed using a short three hour forecast run that completes in about 90 seconds on the chosen platform.
We have described an initial prototype for implementing urgent workflows for predicting the impacts of hurricanes, which include a new priority-aware scheduler, SPRUCE, for token-based authorization and carefully thought out policies on local resources. Despite the promise of this early work, there are many issues to research and resolve in the domain of urgent computing: