Supercomputers give scientists the power to model highly complex and detailed physical phenomena and chemical processes, leading to many advances in science and engineering. With the current growth rates of supercomputing speed and capacity, scientists are anticipated to study many problems of unprecedented complexity and fidelity and attempt to study many new problems for the first time. The size and complexity of the data produced by such ultra-scale simulations, however, present tremendous challenges to the subsequent data visualization and analysis tasks, creating a growing gap between scientists’ ability to simulate complex physics at high resolution and their ability to extract knowledge from the resulting massive data sets. The Institute for Ultrascale Visualization,12 funded by the U.S. Department of Energy’s SciDAC program, 3 aims to close this gap by developing advanced visualization technologies that enable knowledge discovery at the peta and exa-scale. This article reveals three such enabling technologies that are critical to the future success of scientific supercomputing and discovery.
Parallel visualization can be a useful path to understanding data at the ultra scale, but is not without its own challenges, especially across our diverse scientific user community. The Ultravis Institute has brought together leading experts from visualization, high-performance computing, and science application areas to make parallel visualization technology a commodity for SciDAC scientists and the broader community. One distinct effort is the development of scalable parallel visualization methods for understanding vector field data. Vector field visualization is more difficult to do than scalar field visualization because it generally requires more computing for conveying the directional information and more storage space to store the vector field.
So far, more researchers have worked on the visualization of scalar field data than vector field data, regardless of the fact that vector fields in the same data sets are equally critical to the understanding of the modeled phenomena. 3D vector field visualization particularly requires more attention from the research community because most of the effective 2D vector field visualization methods incur visual clutter when directly applied to depicting 3D vector data. For large data sets, a scalable parallel visualization solution for depicting a vector field is needed even more because the expanded space requirement and additional calculations needed to ensure temporal coherence for visualizing time-varying vector data. Furthermore, it is challenging to simultaneously visualize both scalar and vector fields due to the added complexity of rendering calculations and combined computing requirements. As a result, previous works in vector field visualization primarily focused on 2D, steady flow fields, the associated seed/glyph placement problem, or the topological aspect of the vector fields.
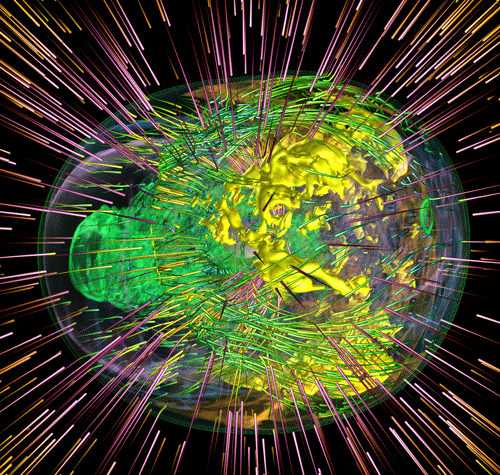
Particle tracing is fundamental to portraying the structure and direction of a vector flow field. When an appropriate set of seed points are used, we can construct paths and surfaces from the traced particles to effectively characterize the flow field. Visualizing a large time-varying vector field on a parallel computer using particle tracing presents some unique challenges. Even though the tracing of each individual particle is independent of other particles, a particle may drift to anywhere in the spatial domain over time, demanding interprocessor communication. Furthermore, as particles move around, the number of particles each processor must handle varies, leading to uneven workloads. We have developed a scalable, parallel particle tracing algorithm allowing us to visualize large time-varying 3D vector fields at the desired resolution and precision.4 Figure 1 shows visualization of a velocity field superimposed with volume rendering of a scalar field from a supernova simulation.

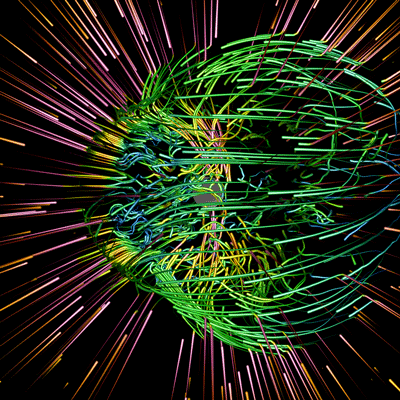
We take a high-dimensional approach by treating time as the fourth dimension, rather than considering space and time as separate entities. In this way, a 4D volume is used to represent a time-varying 3D vector field. This unified representation enables us to make a time-accurate depiction of the flow field. More importantly, it allows us to construct pathlines by simply tracing streamlines in the 4D space. To support adaptive visualization of the data, we cluster the 4D space in a hierarchical manner. The resulting hierarchy can be used to allow visualization of the data at different levels of abstraction and interactivity. This hierarchy also facilitates data partitioning for efficient parallel pathline construction. We have achieved excellent parallel efficiency using up to 256 processors for the visualization of large flow fields.4 This new capability enables scientists to see their vector field data in unprecedented detail, at varying abstraction levels, and with higher interactivity, as shown in Figure 2.


