Modelling Programmer Workflows with Timed Markov Models

November 2006 B
|
Modelling Programmer Workflows with Timed Markov Models
|
November 2006 B |
Software development is a complex process. Many factors influence programmer productivity– experience, choice of programming language, etc. – but comparisons of their effects are primarily anecdotal. We describe a quantitative method to capture programmer workflows using timed Markov models. We fit data collected from programmers in two separate classroom experiments to these timed Markov models, and compare the workflows of programmers using UPC and C/MPI.
Higher level languages such Matlab are often thought to be more productive to program in than Fortran or C. PGAS (partitioned global address space) languages are believed to be easier to use than message passing environments. There are several other widely heldbeliefs about programming and productivity; a well designed IDE might be more productive than command line tools, a debugger might be more productive than debugging by printing, interactive programming environments might allow for quicker development than compiled languages, and so on.
Such hypotheses are often anecdotal – it is hard to prove or disprove them. It should be possible to confirm or refute hypotheses about programmer productivity with a reasonable model of programming workflows coupled with experimental evidence. Quantitative analysis is desirable, but very hard to get.
We believe that our work can lead to an ability to choose a programming environment based on quantitative evaluations instead of anecdotal evidence. Several studies,1 2 3 compare different software engineering processes and programming environments in a variety of ways, mostly qualitative.
Programmers go through an identifiable, repeated process when developing programs, which can be characterized by a directed graph workflow. TMMs (timed Markov models or timed Markov processes) are one way to describe such directed graphs in a quantifiable manner. We describe a simple TMM that captures the workflows of programmers working alone on a specific problem. We then describe an experimental setup in which we instrument the student homeworks in the parallel computing class at UC Santa Barbara. We also describe the tools we developed for instrumentation, modelling, and simulating different what–if scenarios in the modelled data. Using our model and tools, we compare the workflows of graduate students programming the same assignment in C/MPI4 and UPC5> – something that is not possible without a quantitative model and measurement tools.
We describe Timed Markov Processes in Section 2. In Section 3, we describe our modelling of programmer productivity with TMM. Section 4 contains a description of our data collection methodology. We compare UPC and C/MPI data in Section 5. In Section 6, we talk about the various tools we are designing to allow anyone else to perform similar analysis. We finish with concluding remarks in Section 7.

The process of software development is iterative and probabilistic. It is iterative in the sense that a programmer often repeats a sequence of steps in the software development process; edit, compile, launch test run, for example. It is probabilistic in that the times in each of the steps of the process can vary, and the number of times a cycle will be repeated before the programmer can move on to the next phase is unpredictable. A timed Markov process can model both aspects.
A timed Markov process is a Markov process, augmented with dwell times for state transitions. Each state transition has both a probability of transition and a dwell time associated with it. Timed Markov processes closely resemble signal flow graphs, 6for which well known methods exist to estimate time to completion. Iterative design processes and software development processes have been studied using similar techniques.7 8
In Figure 1, prob(B|A) is the probability of transitioning to state B given that the process is now in state A. time(A|B) is the dwell time spent in state A given that the next state transitioned to is B. prob(C|A), which would equal 1-prob(B|A) in this example, is the probability of transitioning to state C given that the process is now in state A.

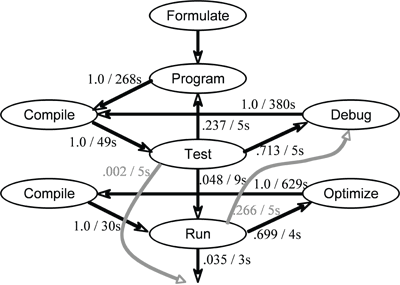
In our earlier work,9 we hypothesize a simple timed Markov model of a researcher developing a new application. It represents our assumption that the researcher begins by formulating a new algorithm for solving the problem of interest and then writes a program implementing the algorithm. Following that, the researcher enters a correctness–debugging loop, around which the process cycles until the program is deemed to be free of programming errors. Next is a performance–tuning loop, which cycles until the program has been tuned enough that it gets adequate performance for large problems to be run on an HPC system. This is the workflow shown in Figure 2. In this workflow:
This model can also be used to describe the workflow of graduate students programming homework in a parallel computing class. We instrumented their programs, collected workflow data and fit it to such a timed Markov model in our 2004 classroom experiment.9 While fitting the experimental data to the model, we discovered that in addition to the transitions described above, there were two more transitions. A programmer may introduce or discover a bug while attempting to optimize the program. As a result, there is a transition from the Run state to the Debug state. Sometimes, the last run may not be successful, perhaps because of a failed attempt to optimize. In such a case, an earlier correct run is treated as the final program – all the data we present is from programs that were eventually correct. Hence, there is another transition from Test to Finish. Figure 3 shows the result of our analysis of the 2004 classroom experiment.
We used a comprehensive framework to collect data in our 2006 classroom experiment. We will describe our 2006 classroom experiment in full detail in a separate paper.10 Briefly, the programmers programmed the Game of Life on a large grid, which would not fit in the memory of a typical desktop computer. The Game of Life is played on a two dimensional grid. Cells may be alive or dead; their state evolves according to set of simple rules based on the state of their neighbors. Half the programmers used C/MPI, while the other half used UPC.
Our data collection process gathers enough data at compile time and run time so that programmer experience can be accurately recreated offline. This allows us to replay the sequence of events (every compile and run) and collect specific data that may be required by the modelling process but was not captured while the experiment was in progress. We used such replays very effectively for our 2004 classroom experiment.9 Our replay capabilities were not perfect then, and we had to use reasonable proxies for run time parameters. We refined our techniques in light of the lessons learned, and achieved perfect replay capabilities for the 2006 classroom experiment.
The programmers were provided with a basic harness that included build infrastructure, data generators, test cases and specific performance targets. We captured timestamps for every compile and run, stored every code snapshot at compile time, and recorded run time information such as number of processors, inputs, correctness and compute time. Due to a glitch in the run time data collection, some of the run time information we needed for the modeling process was missing. However, we were able to gather the missing run time information by replaying every single compile and run for every programmer. The replays took 10 hours to compile, and 950 hours of processor time for all runs.
In our 2004 classroom experiment, the programmers wrote a parallel sorting code using C++/MPI. Since the model based on timed Markov processes was proposed after the 2004 classroom experiment, we used replays to gather the required data and fit it to a timed Markov model. Our experience with data gathering and modeling for the 2004 and 2006 classroom experiments has led us to believe that the replay is the most important facet of the data gathering process.

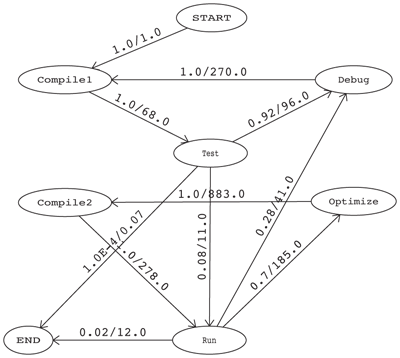
Figure 4 shows the workflow of UPC programmers. Figure 5 shows that of C/MPI programmers. These diagrams of the TMMs were prepared using the TMMsim tool described in Section 6.2. This is a preliminary analysis with a small sample size (five programmers using each language). Thus we do not attempt to draw final conclusions comparing the two languages. However, a number of aspects of these TMMs seem encouraging as regards the feasibility of this type of quantitative analysis.
First, the fitted transition times and probabilities from the 2006 classroom experiment are quite similar to those from the 2004 classroom experiment. Not surprisingly, most (92% to 95%) of the “test” runs lead back into the debug cycle. We see that a “test” run is successful 8% of the time for C/MPI and 5% of the time for UPC; however, in the optimization cycle, 28% of C/MPI runs introduced new bugs compared to only 24% of UPC runs. It is not clear whether these differences are significant for this small sample size. A programmer spends much longer to attempt an optimization (763 seconds for UPC and 883 seconds for C/MPI) than to attempt to remove a bug (270–271 seconds). The time to optimize UPC (763 seconds) is smaller that for MPI (883 seconds), suggesting perhaps that UPC optimization is carried out in a more small–granularity, rapid–feedback way.
The amount of data that needs to be analyzed to produce models of programmer workflows is quite large. We are developing automated tools for visualization, modelling, and simulation of TMMs to facilitate the kind of analysis described in earlier sections.
There are two main types of data that are being collected in the experiments. Physical activities such as code edits, compiles, and executions are automatically captured by the instrumented development environment. During development, in some experiments, the students are also asked to record the time they spend performing logical activities such as thinking, serial coding, parallel coding, and testing. It is these logical activities that we use to create TMMs of the workflows. Alternatively, physical activities can be mapped to logical activities using a set of heuristics.
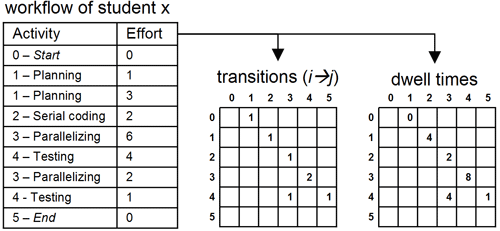
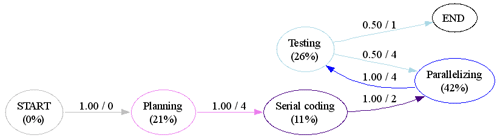
Whether the logical activities come from student logs11 or heuristic mapping,9 12 the end result is a list of activities and associated effort (measured in hours), as shown in Figure 6. We have created a Python program that parses this list of activities for each student and counts the transitions and dwell times for each activity. In the example shown, the student starts in the planning stage and then transitions to serial coding. This is represented in the transition matrix as T12 = 1. Consecutive entries for the same activity are combined. Thus in the dwell time matrix, the amount of time spent in the planning state before transitioning to the serial coding state is represented as D12 = 1 + 3 = 4. These transitions and dwell times can be aggregated across students and similar assignments to create a larger sample for analysis.
We calculate the probability for each state transition from the transition matrix as:
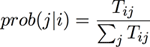
Similarly, the average dwell time for each transition is calculated as:

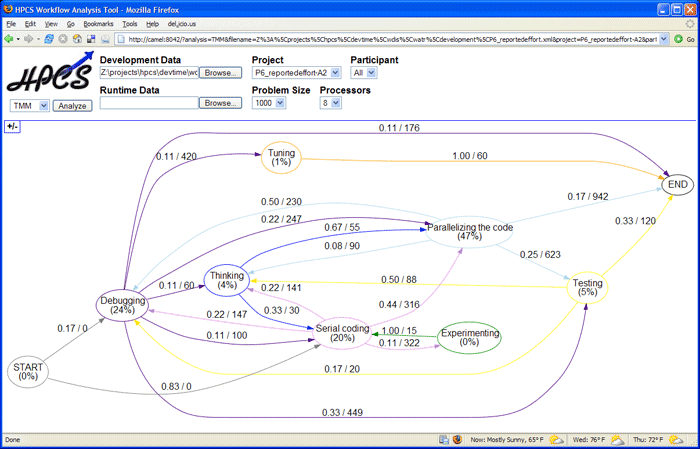
Once the transition probabilities and dwell times have been computed, the next step is to generate a graph description that can be used to visualize the TMM. Our initial choice for visualization was the Graphviz tool, which uses the DOT language for graph description. Figure 7 shows the student workflow from Figure 6 visualized as a TMM using Graphviz. Using Graphviz we have created a graphical browser for rapid visualization of multiple data sets (see Figure 8).
Even with the help of automated tools, such as our prototype described in Section 6.1, the mapping from the activity data collected during a software productivity experiment to a workflow diagram and its corresponding TMM will rarely be trivial. Programmers do not necessarily follow the exact same steps when developing or modifying code. The detailed actions programmers take can be abstracted to higher-level workflow steps in a variety of ways, some of which may turn out to be much more faithful models than others. Thus we expect that it may take several tries to obtain an acceptably accurate mapping from experimental data to a workflow.
We therefore wanted a tool with which we could:

We based TMMsim, our TMM drawing and simulation software on VGJ,13 a Java-based tool (“Visualizing Graphs in Java”) for drawing directed and undirected graphs. The key feature we added was the ability to annotate each edge of the graph with a dwell time and a probability of departing the previous state via this edge, as required by a timed Markov model. The tool uses a slightly extended version of the Graph Modeling Language (GML)14 to input previously defined TMMs, including those generated by our TMM generation tool (Section 6.1). Simple simulation code calculates the average time through the TMM workflow of 100, 000 instances of its use. Figure 9 shows the TMM viewer/simulators user interface, along with a dialog box that has been opened in order to annotate the edge of an example TMM with a dwell time and a transition probability. The “Range” buttons in the edge annotation dialog allow a sequence of values to be used instead of a single number for the dwell time or the probability, causing a simulation average to be generated for each of the values, for the sake of sensitivity analysis.
We believe that programmers go through an identifiable, repeated process when developing programs, which can be characterized by a directed graph model such as timed Markov models. We successfully gathered data and fit it to timed Markov models twice, in our 2004 and 2006 classroom experiments. The replay of programmer experience offline was one of the most important aspects of the data gathering process. The timed Markov models clearly indicate the most time intensive parts of the development cycle, quantitatively confirming our intuition – programmers spend most of their time debugging and, once they get a correct program, tuning it for performance is even more difficult. Our data also suggests, in this context, that programmers may introduce slightly fewer bugs in UPC programs and find it easier to optimize them, as compared to C/MPI programs.
Clearly, this is only the beginning. A lot more data needs to be collected before languages can be compared in a meaningful way. Towards this end, we are building various tools for the community at large. These tools will provide a general framework for data collection and model construction to study programmer productivity in a variety of ways.