One of the aims of creating the models of scientific applications is to be able to predict the application requirements for the future problem configurations at scale. We use our MA models to understand the sensitivity of floating-point operations, memory requirements per processor, and message volume to applications’ input parameters.
We begin experiments with a validated problem instance, Class C, for both the NAS CG and SP benchmarks, and scale the input parameters linearly. Note that the MA framework has a post-processing toolset that allows validation of MA model annotations with the runtime values. For instance, the PAPI_FP_OPS (number of floating-point operations) empirical data was compared with the ma_flop predicted value. The validated problem instances, Class C, have na=150000, nonzer=15, for the CG Class C benchmark with 128 MPI tasks. We increase the value of na linearly and generate the floating-point and load-store operation count using the MA symbolic models of the NAS CG benchmark. Figure 6 shows that the floating-point and load-store cost in the CG experiments increase linearly with the na parameter value. Similarly, we generated the growth rates for the floating-point and load-store operation cost for the other input parameter, nonzer. Results in Figure 6 and Figure 7 show that the floating-point and load-store operation cost in CG are relatively more sensitive to the increase in the number of nonzer elements in the array than the array size: na.
In the second experiment, the NAS SP benchmark has a single application parameter, problem_size, which we have used to represent the workload requirements (floating-point, load-store, memory and communication) in the MA symbolic models. Figure 8 shows the increase in the floating-point and load-store operation count by increasing the problem_size linearly. Note that like CG, the initial set of experiments (Class S, W, A, B, C and D) are validated on the target MPP platforms. Figure 8 shows that the floating-point operation cost increases at a very high rate by increasing the problem_size.
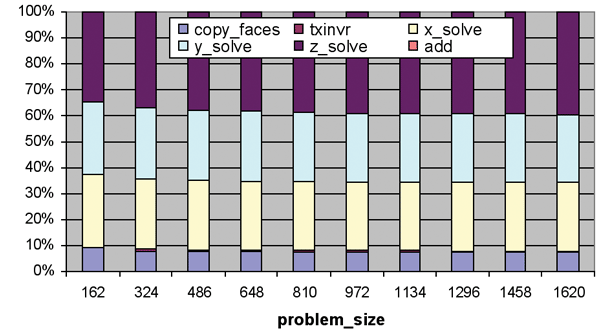
Using the MA models, we not only generate the aggregated workload requirements shown earlier, but we also get an insight into the scaling behavior of the workload requirements within an application as a function of the problem_size parameter. Figure 9 shows the contribution of different functions in total floating-point operation count in SP time step iterations. The results shown in Figure 9 are generated for a fixed number of MPI tasks and by increasing the problem_size parameter linearly. The floating-point workload requirements generated by the MA model show that the z_solve is the most expensive function for runs with large number of processors. The cost of x_solve and y_solve are identical and consistent. Moreover, based on the MA model results shown in Figure 9, we can safely ignore the cost of txinvr and add functions in the further analysis.


