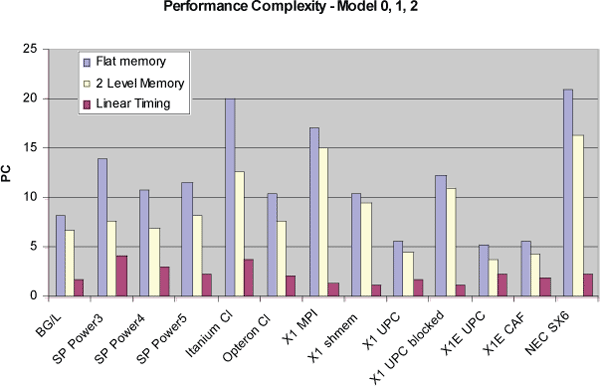

Analyzing parallel Apex-MAP results for 256 processors and a memory consumption of 512MB/process, I face the additional problem of a greatly increased range of raw performance values, which now span five orders of magnitude compared to two for serial data. This would not be feasible without a sound statistical procedure. This analysis is of special interest as I have obtained performance results with different parallel programming paradigms such as MPI, shmem, and the two PGAS languages, UPC and CoArray Fortran (CAF) on the Cray X1 and X1E systems. 2 In UPC, two different implementations are compared; one for accessing a global shared array element by element and one for a block-transfer access to re-mote data.
PC values for model 0 in Figure 6 show the highest values for the NEC SX6, an Itanium-Quadrics cluster, and the Cray X1 used with MPI. The lowest complexities are measured for shmem and the PGAS languages on the X1 and X1E. Such a clear separation between these different language groups was surprising. The PC value for a global array implementation in UPC is also much lower than for a blocked access.

Model 1 resolves performance better on all tested systems, but again has higher PC values than model 2. The linear timing model is now superior as it fits message exchange on interconnects much better than a naïve two level memory model. Model 2 represents a programmer coding for long loops and large messages. The combined model 3 resolves performance by far the best. It represents a programmer who optimizes for long loops, large messages, and high data locality. The lowest complexity PC values are for blocked access in UPC and shmem on the X1.
Inspection of residual errors for BlueGene/L in Figure 8 shows larger deviations for message sizes of 256 Bytes and larger with a maximum for 1kB. Flit size on this system is 256Bytes, which suggests influence of the change in protocol once more than one flit is necessary to send a message. The X1 with MPI shows large residual error for high temporal localities. To achieve a best fit, the local memory size for this system has to be set to 8GB, which is 16 times the memory used by a single process. These two observations suggest that the second level of system hierarchy has not resolved the local memory access performance. The Opteron Infiniband cluster exhibits a clear signature of a communication protocol change for messages of a few kB size.

The most important level in the memory hierarchy of a system is expressed by the local memory size of c, which for most systems needs to be set to the SMP memory rather than process memory to achieve best model accuracy. While this is not surprising, there are a fair number of systems for which best model fit is achieved for even larger values of c. This is an indication that network contention might be an important factor for the randomized, non-deterministic communication pattern of Apex-MAP, which is not included at all in any of my models. I tested several more elaborate models with a third level of hierarchy and with constant overhead terms for parallel code overhead, but none of these model produced significant improvements and back-fitted parameter values often did not make sense.
Figure 9 shows back-fitted values for l and g in model 3. Latencies for PGAS languages are noticeably lower than for other languages even on the same architecture. In contrast to this, remote gap values seem to be mostly determined by architecture.


