

Incorporating application characteristics into our rankings can be done by computing a weighted sum of the machine characteristics. Intuitively, the weights are a measure of how much an application uses that particular machine resource.
Although this allows for different rankings of machines for different applications (since each application has different characteristics), we focus on trying to find a single representative application whose characteristics can be used to generate a single “reasonable” ranking for all eight of the applications in our test suite. Later, in Section 3.2, we discuss application-specific rankings.
We first try using only information gathered on the applications’ memory behavior (gathered using the Metasim Tracer18), ignoring interprocessor communication. While we test the ranking generated by data collected for each application, we are looking for a fixed ranking that can be used across all applications. Hence, we only report on the best ranking. This represents the result of taking the characteristics of a single application and using it to generate a ranking of the machines that can be used across a range of applications.
After determining that simply counting the number of floating point operations and total memory accesses did not generate reasonable rankings, we tried partitioning the memory accesses. We partition m into m = m1 + mr, where m1 is the number of strided accesses and mr is the number of random accesses to memory. This is appealing because it may be possible to do this division in an architecture independent way.
Since there is no established standard for what it means to partition memory accesses between strided and random, we use a method based on the Metasim tracer.18 This method partitions the code for an application into non-overlapping basic blocks and then categorizes each basic block as exhibiting primarily either strided or random behavior. For the results in this paper we classify each basic block using two methods — if either decides the block contains at least 10% random accesses, we categorize all memory accesses in that block as random. The number 10% is somewhat arbitrary, but is based on the observation that on many machines the sustainable bandwidth of random accesses is less than the sustainable bandwidth of strided accesses by an order of magnitude.
We determine if memory accesses are random using both a dynamic analysis method and a static analysis method. The first uses a trace of the memory accesses in each basic block and considers each access to be strided if there has been an access to a sufficiently nearby memory location within a window consisting of some small number of immediately preceding memory accesses. The advantage of a dynamic approach is that every memory access is evaluated, so nothing is overlooked. The disadvantage is that the size of the window must be chosen carefully. If the size is too small, we may misclassify some strided accesses as random. If the size is too large, the process becomes too expensive computationally. In contrast, the static analysis method searches for strided references based on an analysis of dependencies in the assembly code. Static analysis is less expensive than dynamic analysis and also avoids potentially misclassifying accesses due to a window size that is too small. On the other hand, static analysis may miss some strided accesses because of the difficulty of analyzing some types of indirect accesses. Since the two types of analysis are predisposed to misclassify different types of strided accesses as random, we apply both methods and consider an access to be strided if either method predicts it to be so.
Having partitioned the memory accesses into random (mr) and strided (m1), we use Equation 1 to compute the numbers r1, r2, . . . , rn from which the ranking is generated:
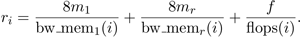
Notice that we must choose what to use for bw_mem1 and bw_memr. Options include the bandwidths of strided and random accesses to main memory; the bandwidths of strided and random accesses to L1 cache; or, considering the data in Table 1, the bandwidth of strided access to main memory and of random access to L1 cache. Furthermore, since we are looking for a single, fixed ranking that can be applied to all applications, we also need to consider which application’s m1, mr, and f to use in the ranking. In theory we could also ask what processor count of which application to use for the ranking; in practice, we only gathered m1 and mr counts for one processor count per application.


