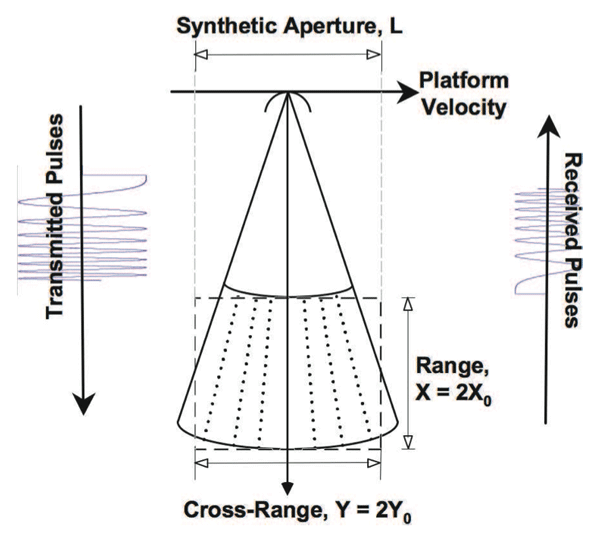
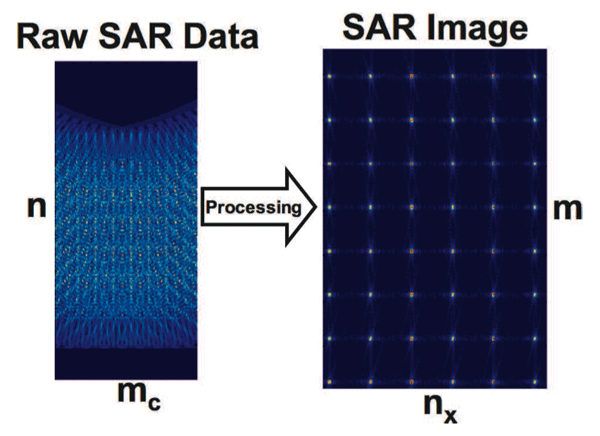
Synthetic Aperture Radar (SAR) is one of the most common modes in a RADAR system and one of the most computationally stressing to implement. The goal of a SAR system is usually to create images of the ground from a moving airborne RADAR platform. The basic physics of a SAR system begins with the RADAR sending out pulses of radio waves aimed at a region on the ground that it usually perpendicular to the direction of motion of the platform (see Fig. 3). The pulses are reflected off the ground and detected by the RADAR. Typically the area of the ground that reflects a single pulse is quite large and an image made from this raw unprocessed data is very blurry (see Fig. 4). The key concept of a SAR system is that it moves between each pulse, which allows multiple looks at the same area of the ground from different viewing angles. Combining these different viewing angles together produces a much sharper image (see Fig. 4). The resulting image is as sharp as one taken from a much larger RADAR with a “synthetic” aperture the length of the distance traveled by the platform.
There are many variations on the mathematical algorithms used to transform the raw SAR data into a sharpened image. SSCA #3 focuses on the variation referred to as “spotlight” SAR. Furthermore, SSCA #3 is a simplified version of this algorithm that focuses on the most computationally intensive steps of SAR processing that are common to nearly all SAR algorithms.
The overall block diagram for this benchmark is shown in Fig. 5 At the highest level it consists of three stages:


SDG: Scalable Data Generator. Creates raw SAR inputs and writes them to files to be read in by Stage 1.
Stage 1: Front-End Sensor Processing. Reads in raw SAR inputs, turns them into SAR images, and writes them out to files.
Stage 2: Back-End Knowledge Formation. Reads in several SAR images, compares them and then detects and identifies the difference.
Although the details of the above processing stages vary dramatically from RADAR to RADAR the core computational details are very similar: input from a sensor, followed by processing to form an image, followed by additional processing to find objects of interest in the image.


