In the HPCS program a series of classroom experiments was conducted in which students were asked to create serial and parallel programming solutions to classical problems (see “Experiments to Understand HPC Time to Development” in this issue). The students used C, Fortran, and Matlab for their serial codes, and created parallel versions using MPI, OpenMP, and Matlab*P (“StarP”)6 Using a combination of student effort logs and automated tools, a variety of information was collected, including development time, code size, and runtime performance.
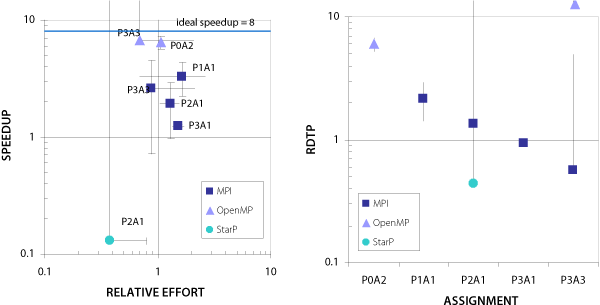
In Figure 1, the graph on the left depicts speedup vs. relative effort for seven classroom assignments. Each data point is labeled according to professor and assignment number, e.g., “P0A1.” The graph on the right plots the median RDTP values for these same classroom assignments (P2A1 and P3A3 each involved two sub-assignments using different programming models). The speedup and relative effort were computed by comparing each student’s parallel and serial implementations, and the median values for each assignment are plotted on the graph on the left. Error bars indicate one standard deviation from the median value. For purposes of comparison, all performance data was taken from runs using eight processors.
The MPI data points for the most part fall in the upper-right quadrant of the speedup vs. relative effort graph, indicating that students were generally able to achieve speedup using MPI, but at the cost of increased effort. The OpenMP data points indicate a higher achieved speedup compared to MPI, while at the same time requiring less effort. A plot of the RDTP metric (Figure 1, right) makes this relationship clear. Based on the results from these experiments, students were able to be the most productive when using OpenMP. While the StarP implementations required the least relative effort, most students were not able to achieve speedup. This is reflected in the lower RDTP value for StarP.


